Equation of a Line
A line can be used to extrapolate predictions into the future. If you know two points that a line passes through you can define the equation of a line. The equation of a line is defined as

- y is the dependent variable or result
- m is the slope of the line
- x is the independent variable or control
- c is the intercept where the line crosses the y axis
Linear Regression
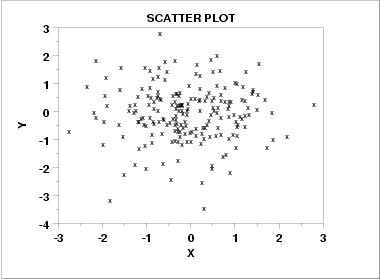
Sometimes a data set will have more than 2 points, and the points may be roughly arranged in a visible direction but not precisely. In cases like this a simple line equation will not work. For example when provided with a scatterplot of data, there is no specific slope or intercept and it must be estimated.
When there are several points in a dataset a modified version of the standard line equation can be used, where the slope and intercept are estimated using a calculation. The equation for simple linear regression is as follows:

- y is the dependent variable or predicted result
- β is the estimated slope of the line
- x is the independent variable or control
- α is the estimated intercept where the line crosses the y axis
The value for the slope can be estimated using the following equation:

- x̄ is the mean of x
- ȳ is the mean of y
- i is the instance of data
- x_i is the independent variable for a given instance of data
- y_i is the dependent variable for a given instance of data
The value for the intercept can be estimated using the following equation:

Performance Considerations
Performing a simple linear regression on data stored in a CSV file will usually involve typical operations such as reading the file from disk, copying it across the network, storing it temporarily in an object in memory, performing a few calculations and displaying a result. The slowest parts of this task are usually reading the file from the hard drive and transferring it across the network.
Database functions and procedures
Most database management systems come with some primitive functions for performing common mathematical operations such as max(), average() and round(). These functions allow us to perform operations on data inside the database without having to export it first to the filesystem or across the network. Performing the mathematical operations using database functions can save a significant amount of time. Some databases such as DB2 have functions already built in to perform operations such as simple linear regression.
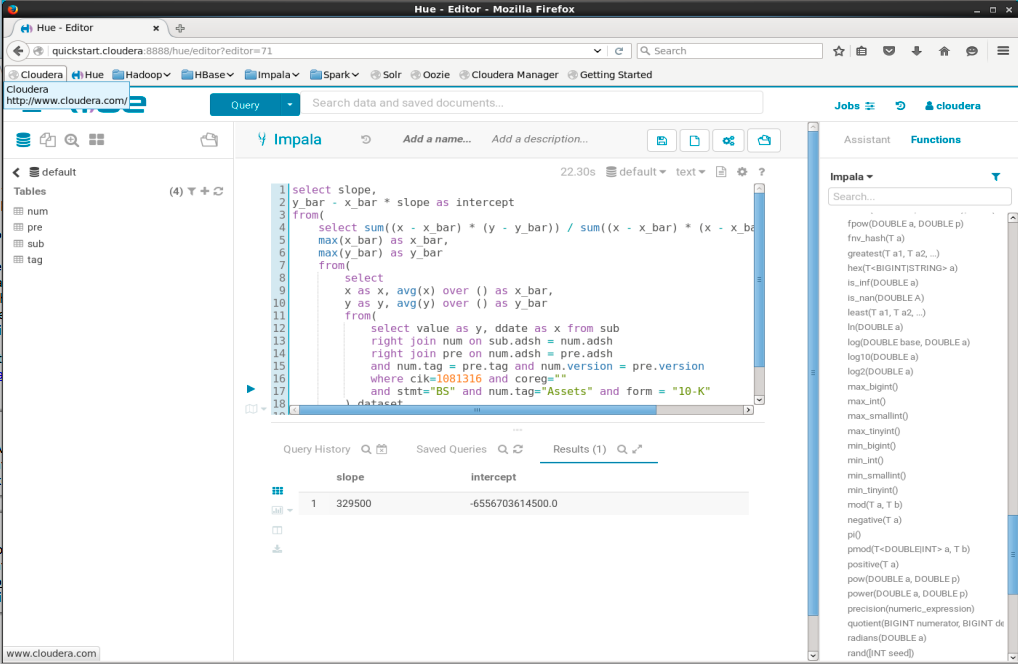
It is possible to calculate Linear Regression Coefficients in SQL by using window functions:1
2
3
4
5
6
7
8
9
10
11
12
13
14
15
16
17
18
19
20select slope,
y_bar - x_bar * slope as intercept
from(
select sum((x - x_bar) * (y - y_bar)) / sum((x - x_bar) * (x - x_bar)) as slope,
max(x_bar) as x_bar,
max(y_bar) as y_bar
from(
select
x as x, avg(x) over () as x_bar,
y as y, avg(y) over () as y_bar
from(
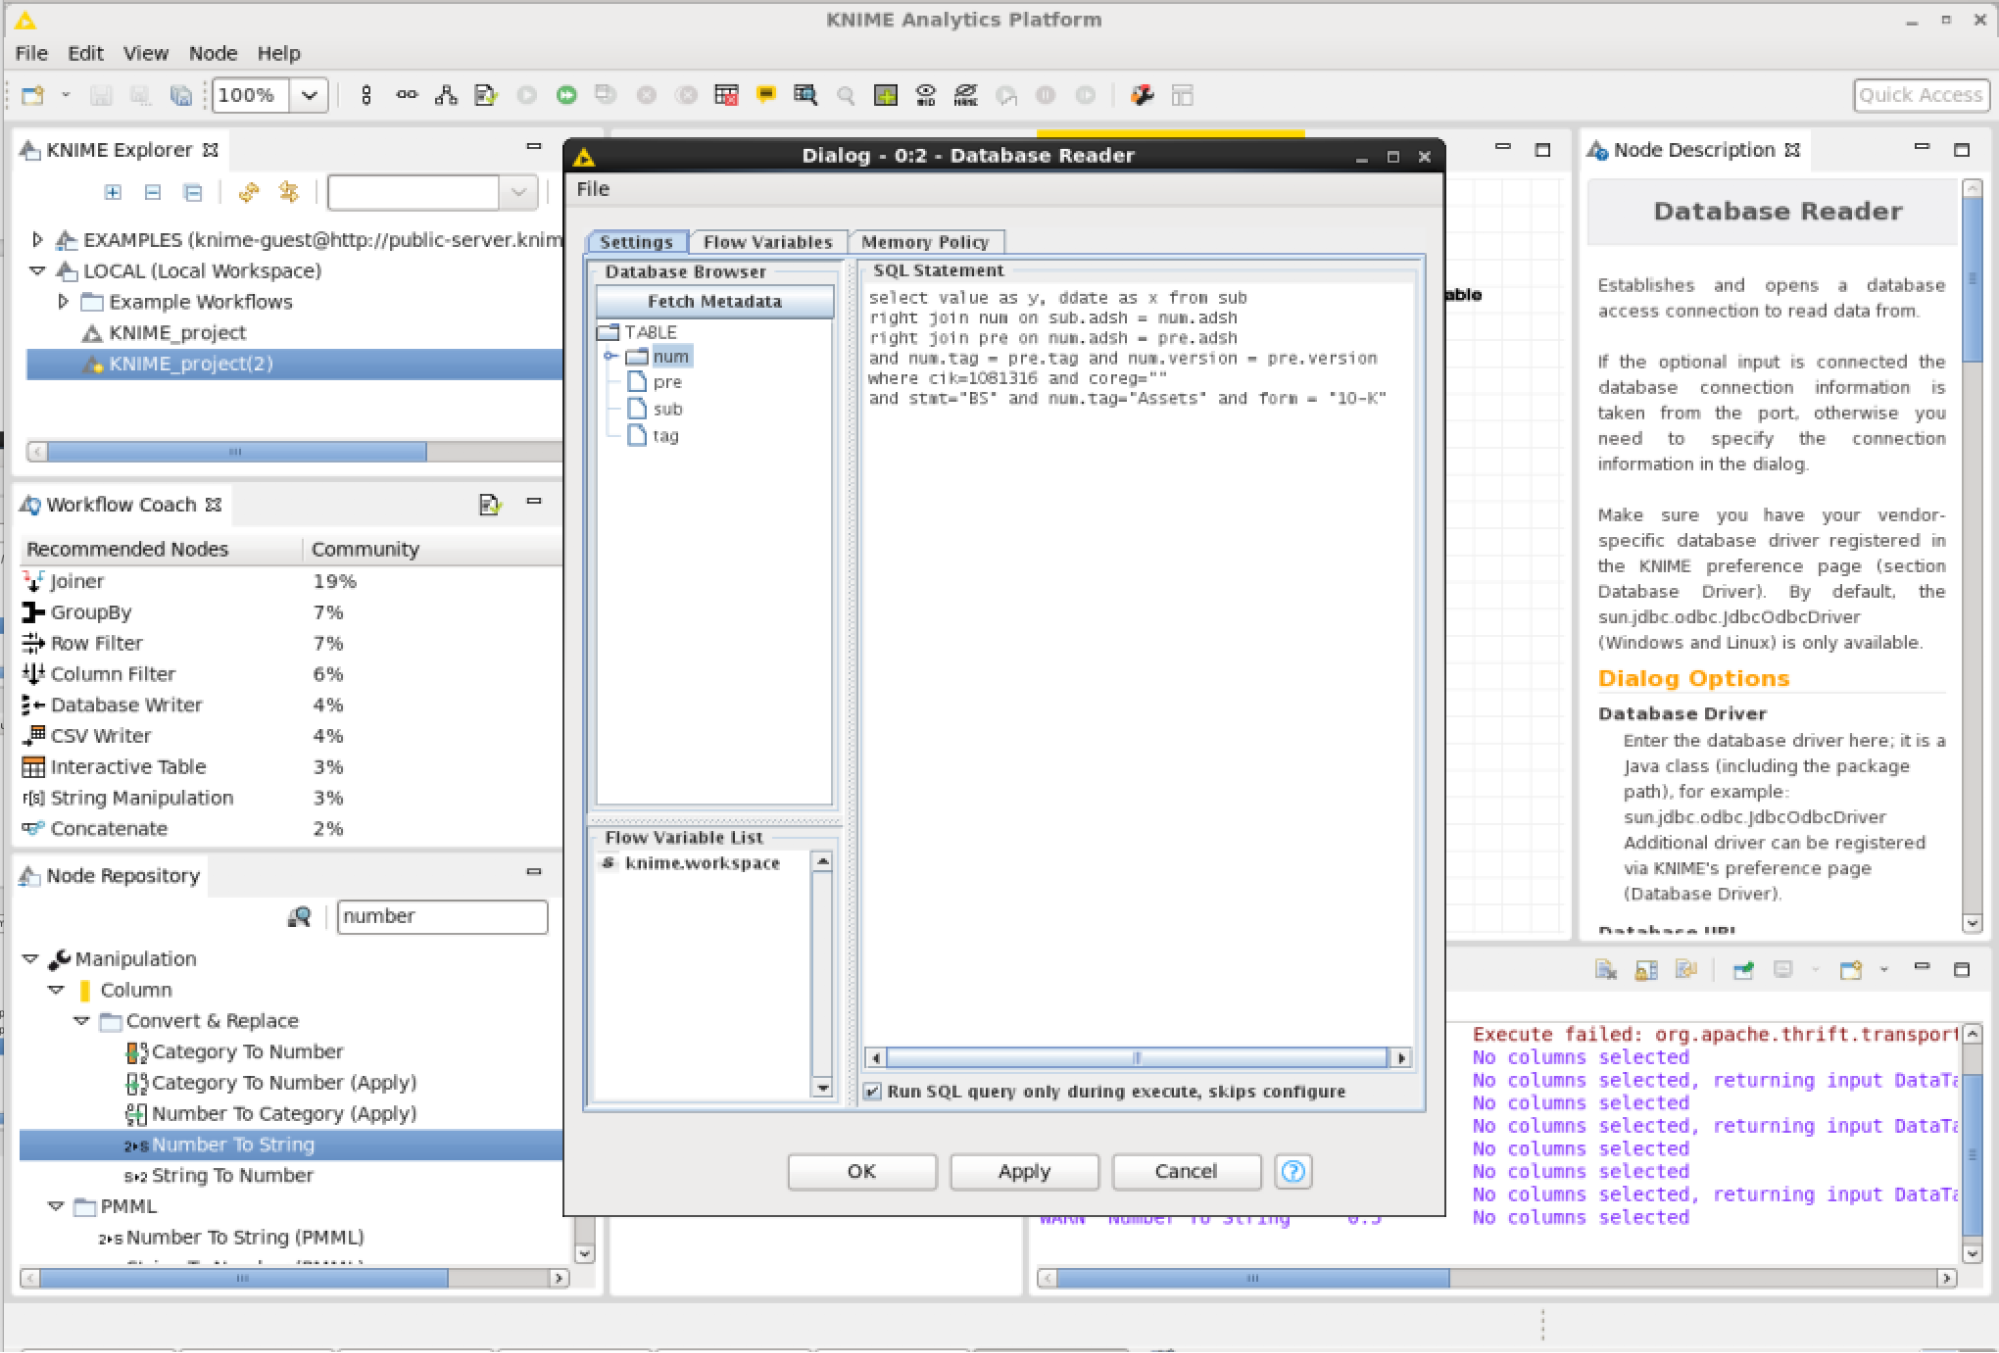
select value as y, ddate as x from sub
right join num on sub.adsh = num.adsh
right join pre on num.adsh = pre.adsh
and num.tag = pre.tag and num.version = pre.version
where cik=1081316 and coreg=""
and stmt="BS" and num.tag="Assets" and form = "10-K"
) dataset
) s
) i;
Impala functions and procedures
Apache Impala is an open source parallel processing SQL query engine for data stored in a computer cluster running Apache Hadoop. Stored procedures as database objects are not supported by Impala yet. Impala does however support User Defined Functions (UDFs) written in C++, and Hive UDFs written in Java.
Apache MADlib
Apache MADlib is an open-source library for scalable in-database analytics. It provides data-parallel implementations of mathematical, statistical and machine learning methods for structured and unstructured data. MADlib operates on the data locally in-database and does not move data between multiple runtime environments unnecessarily.
MADlib Port
MADlib Port brings in-DBMS data analytics to Impala. MADlib Port is a fork of a project called Apache MADlib which is an open source library for scalable in-database analytics. It provides data-parallel implementations of machine learning, mathematical, statistical, and graph methods on the PostgreSQL family of databases. The port of Apache MADlib to Impala is for MADlib v1.0 and requires boost v1.54 and is not being actively maintained.
Knime
KNIME is a free and open-source data analytics, reporting and integration platform. KNIME integrates various components for machine learning and data mining through its modular data pipelining concept. The KNIME Big Data Connectors extension allow easy access to Apache Hadoop data from within KNIME Analytics Platform and KNIME Server. This extension offers a set of KNIME nodes for accessing Hadoop/HDFS via Hive or Impala and ships with all required libraries.
Installing KNIME on Cloudera
To install and configure KNIME on Cloudera Quickstart VM run the following commands in bash:1
2
3
4
5
6$ sudo yum install webkitgtk
$ cd ~/Downloads
$ wget https://download.knime.org/analytics-platform/linux/knime_3.5.3.linux.gtk.x86_64.tar.gz
$ tar -xzvf knime_3.5.3.linux.gtk.x86_64.tar.gz
$ cd *knime*
$ ./knime
Then install the Impala KNIME database connector extension: Press File -> Install KNIME Extensions -> Search “Big Data Connectors” -> Tick Checkbox -> Next -> Next -> Select “I accept the terms of the license agreements” -> Finish -> Restart Knime
Perform a Basic Impala Query
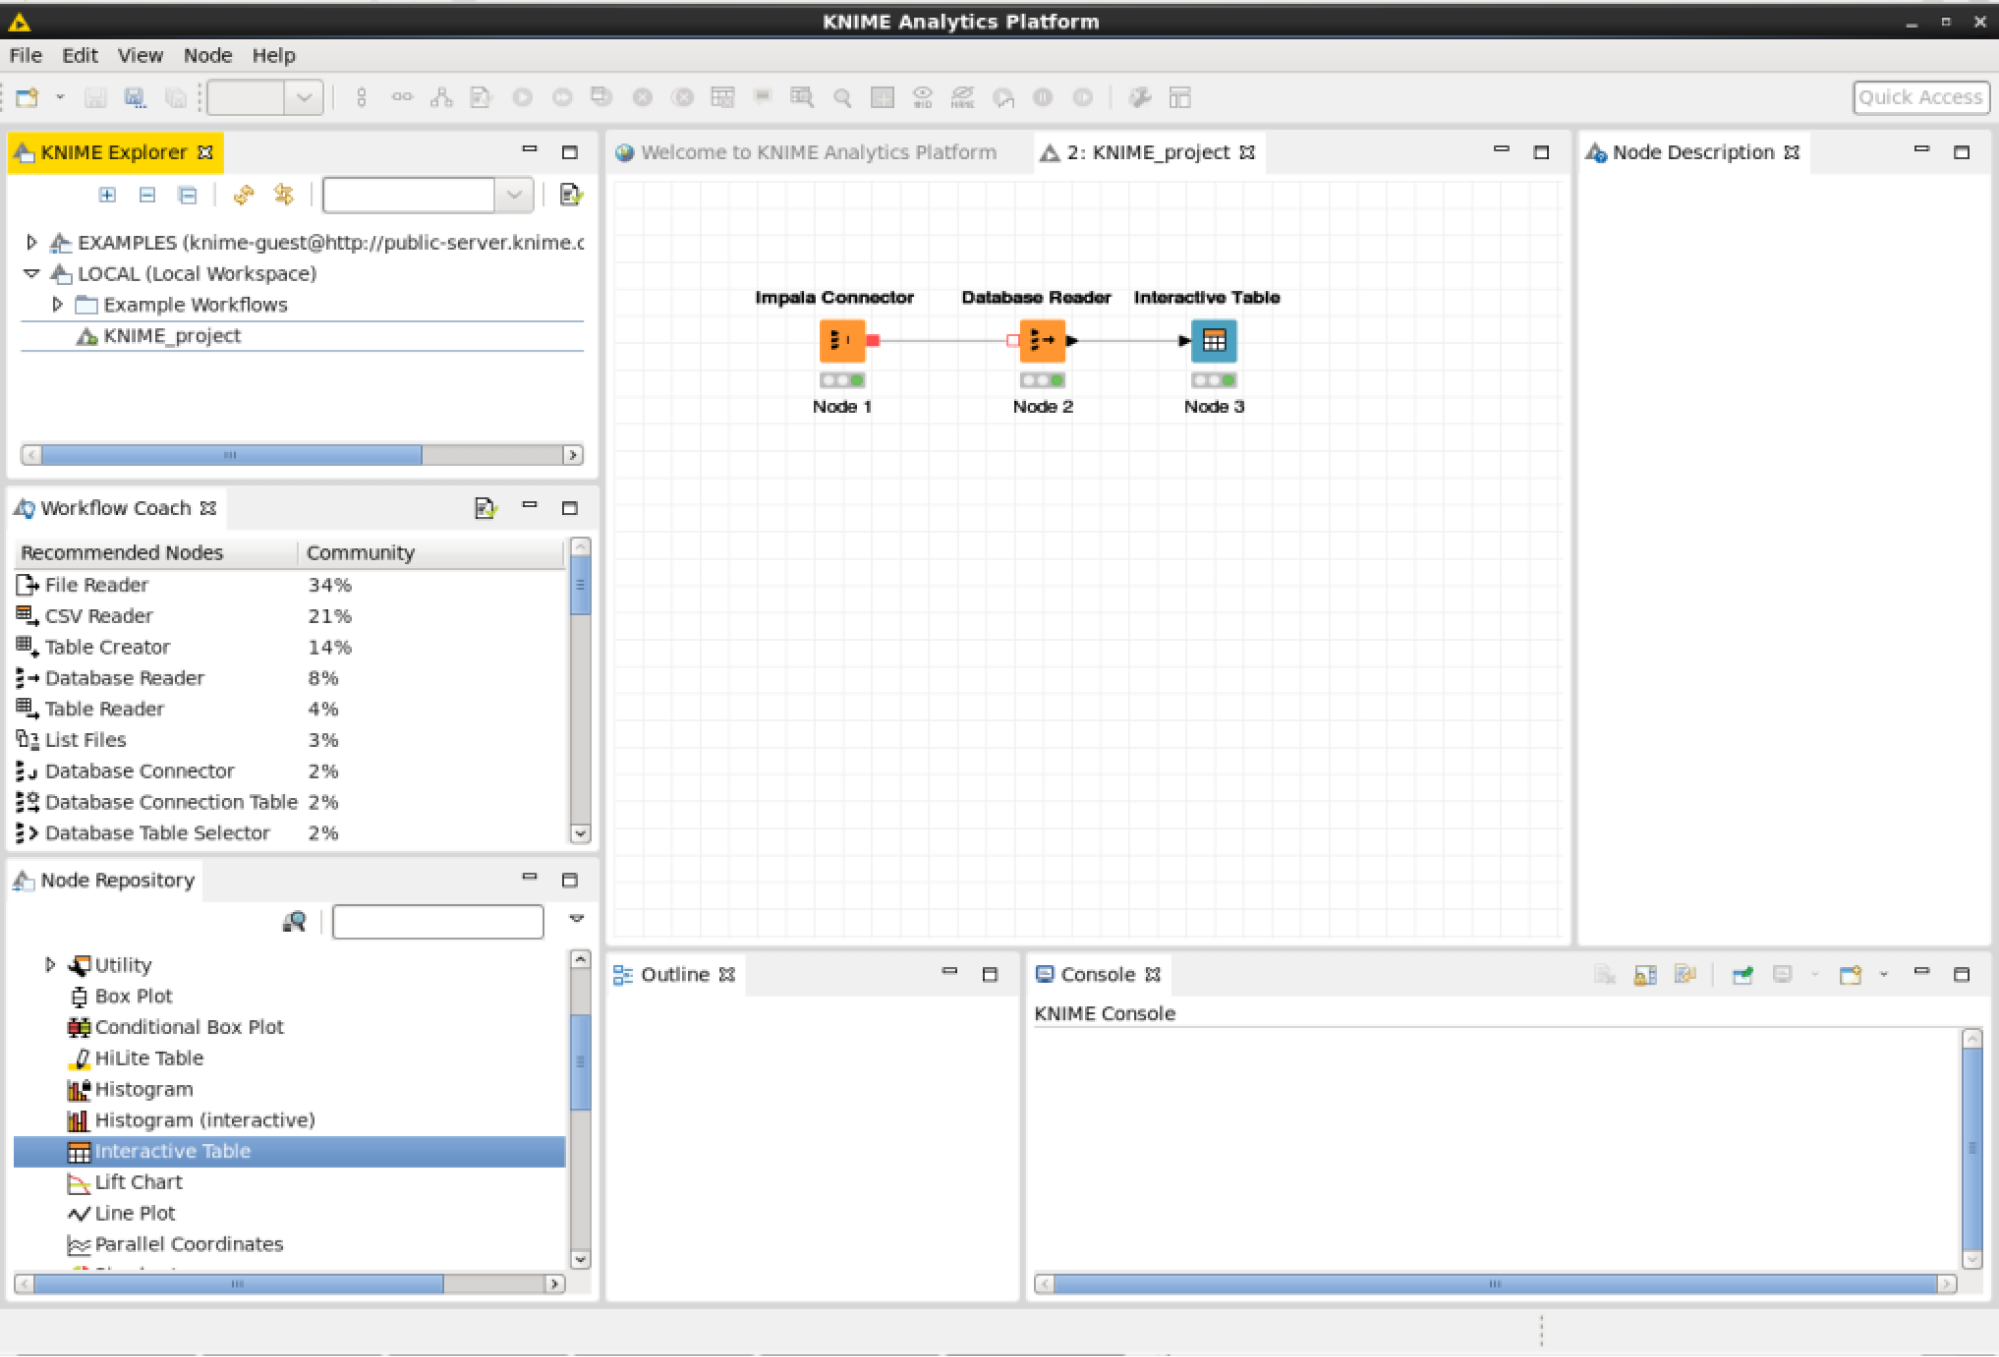
Create a new workflow: Press File -> New -> New KNIME Workflow -> Next -> Finish.
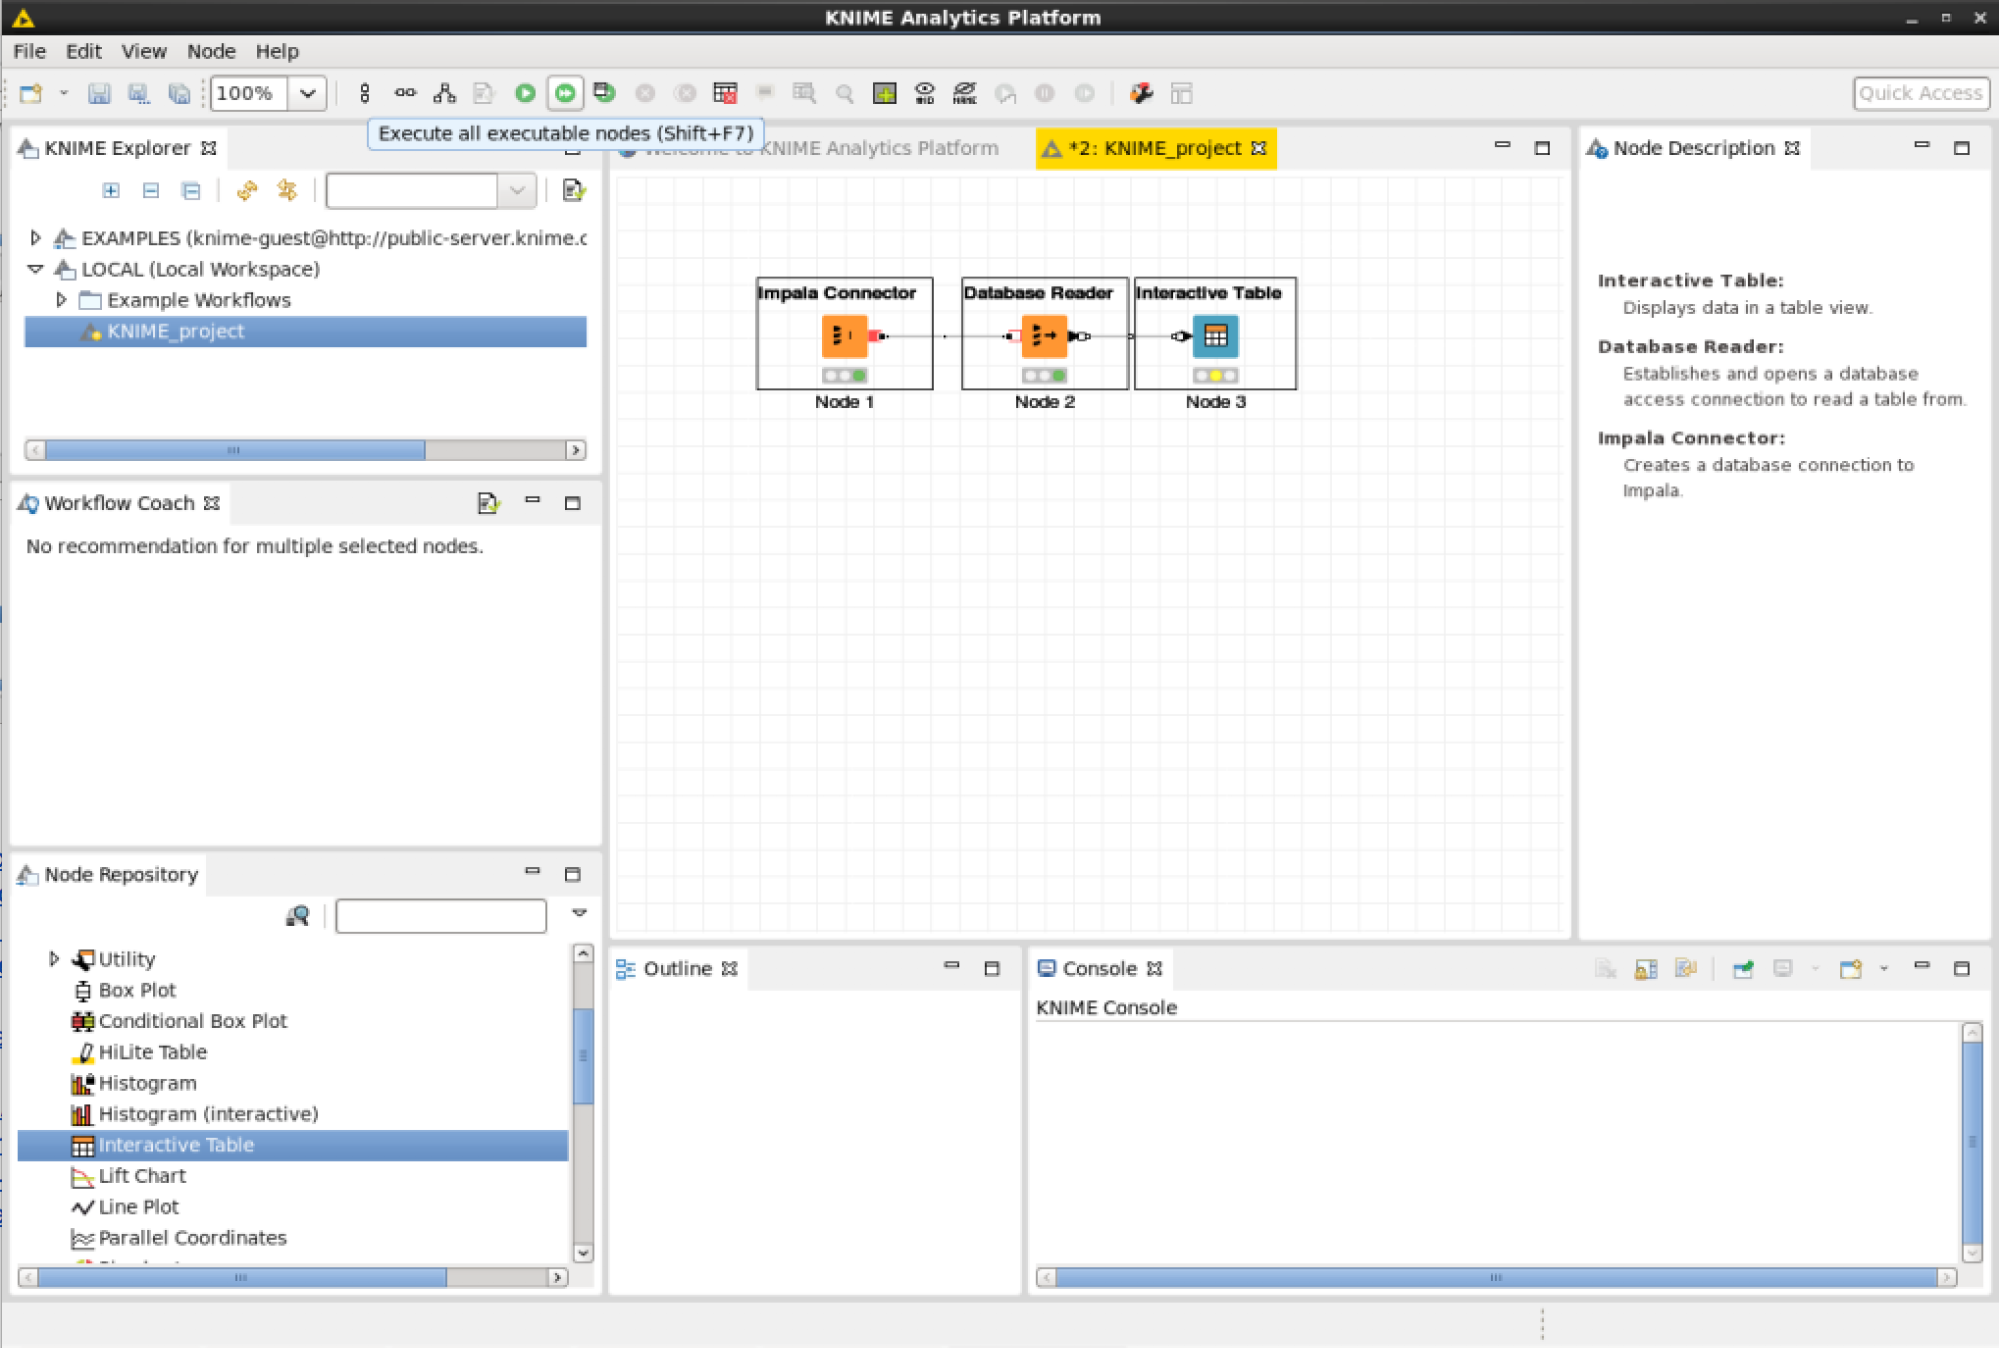
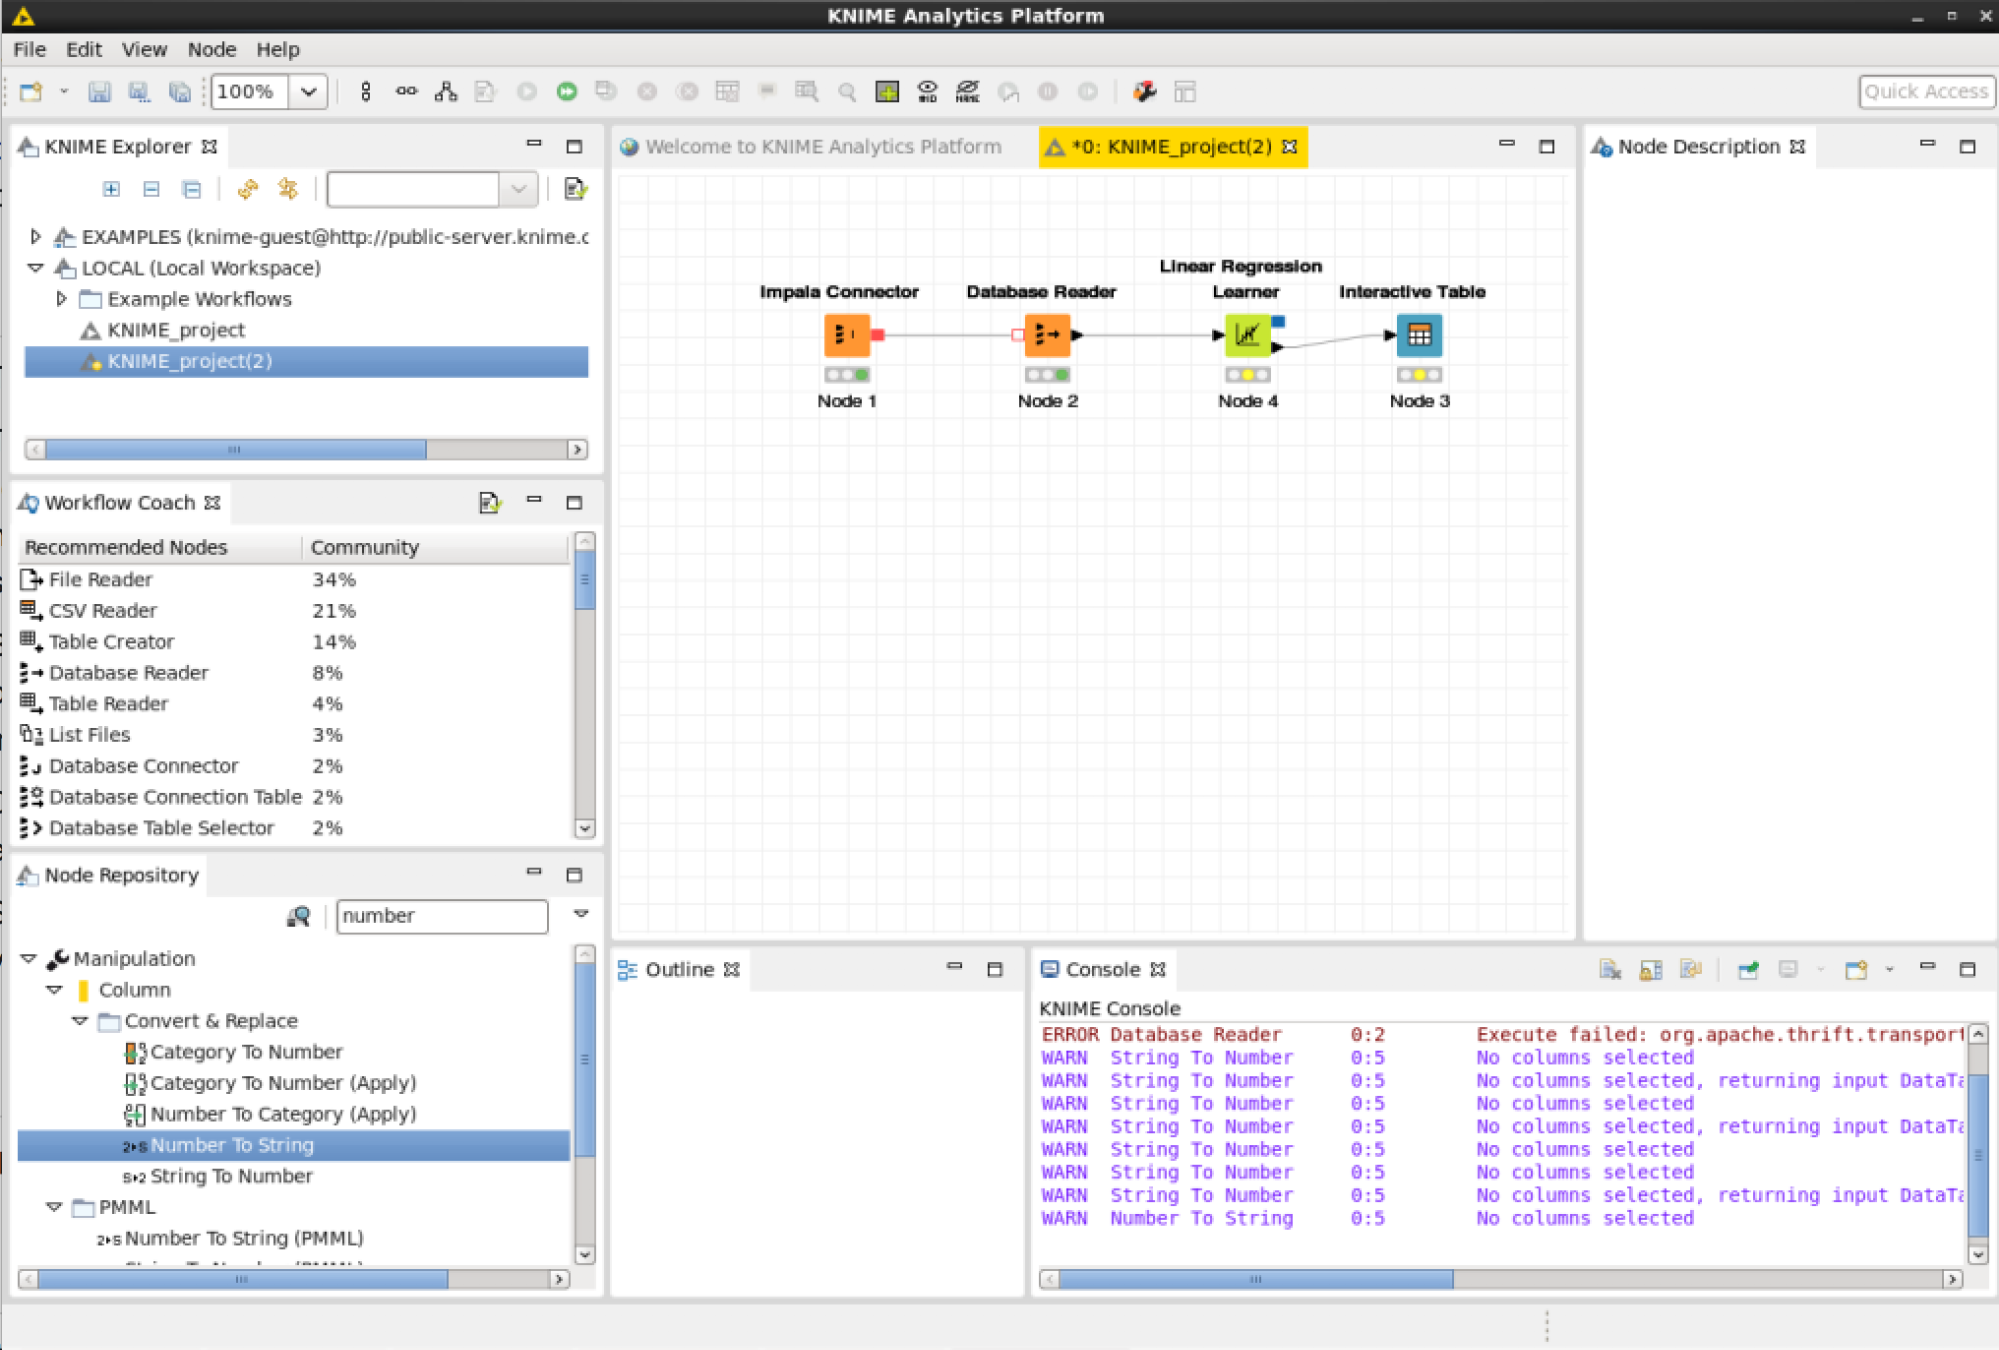
To perform a simple SQL query to Impala drag an “Impala Connector”, a “Database Reader” and an “Interactive Table” on to the user interface.
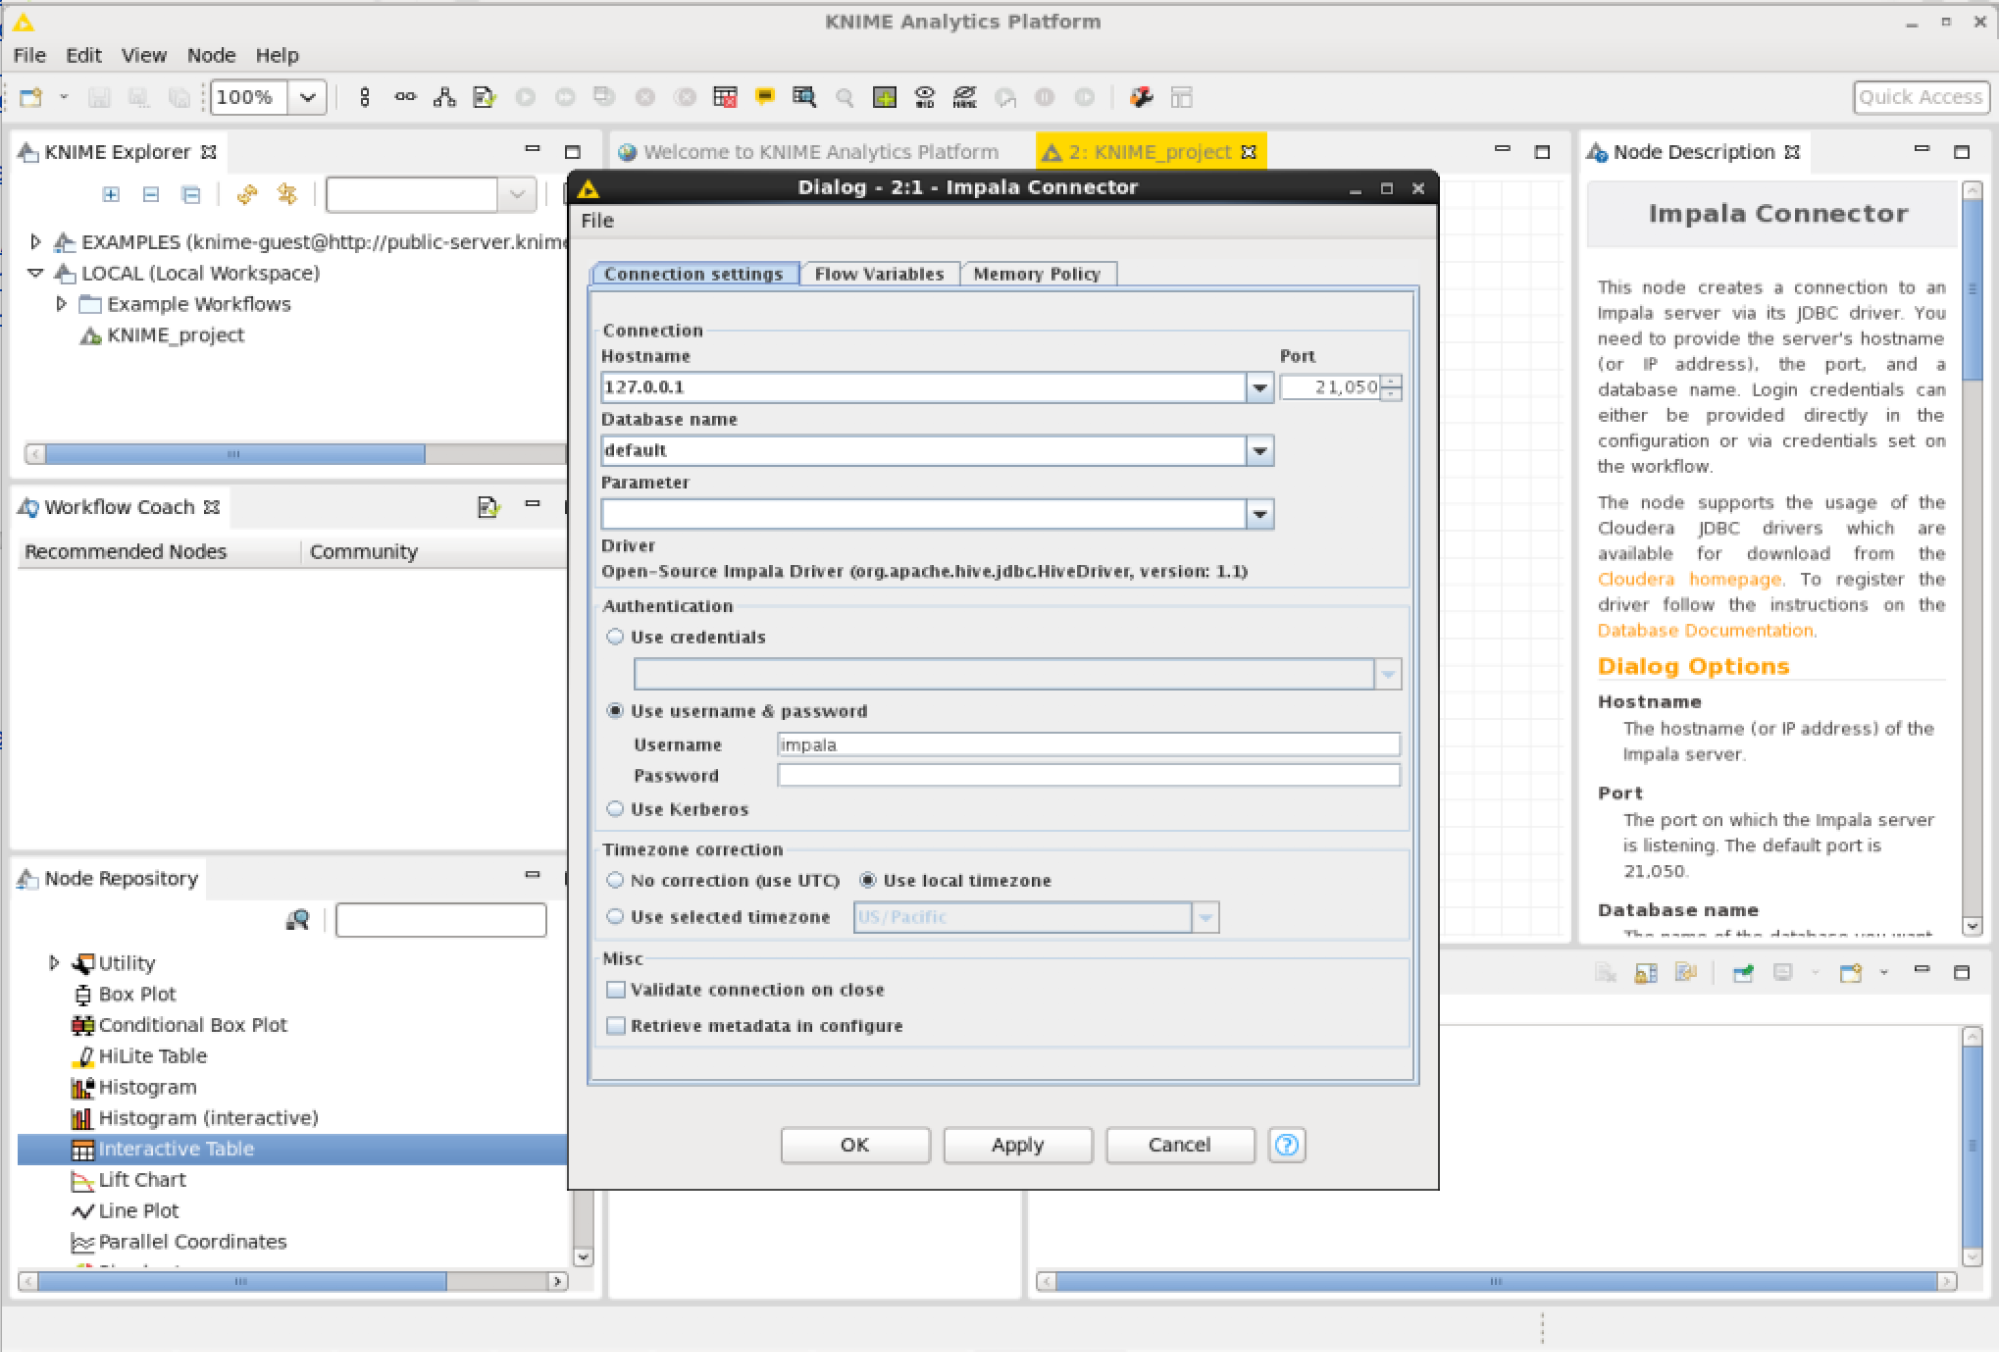
Configure the Impala Connector: Under the “Node Repository” view drill down to -> Database -> Connector -> Impala Connector -> Drag it on to the workflow -> Right click -> Configure.
Use the following settings:
- Hostname: 127.0.0.1
- Database Name: default
- Use username and password
- username:impala
- password: <EMPTY>
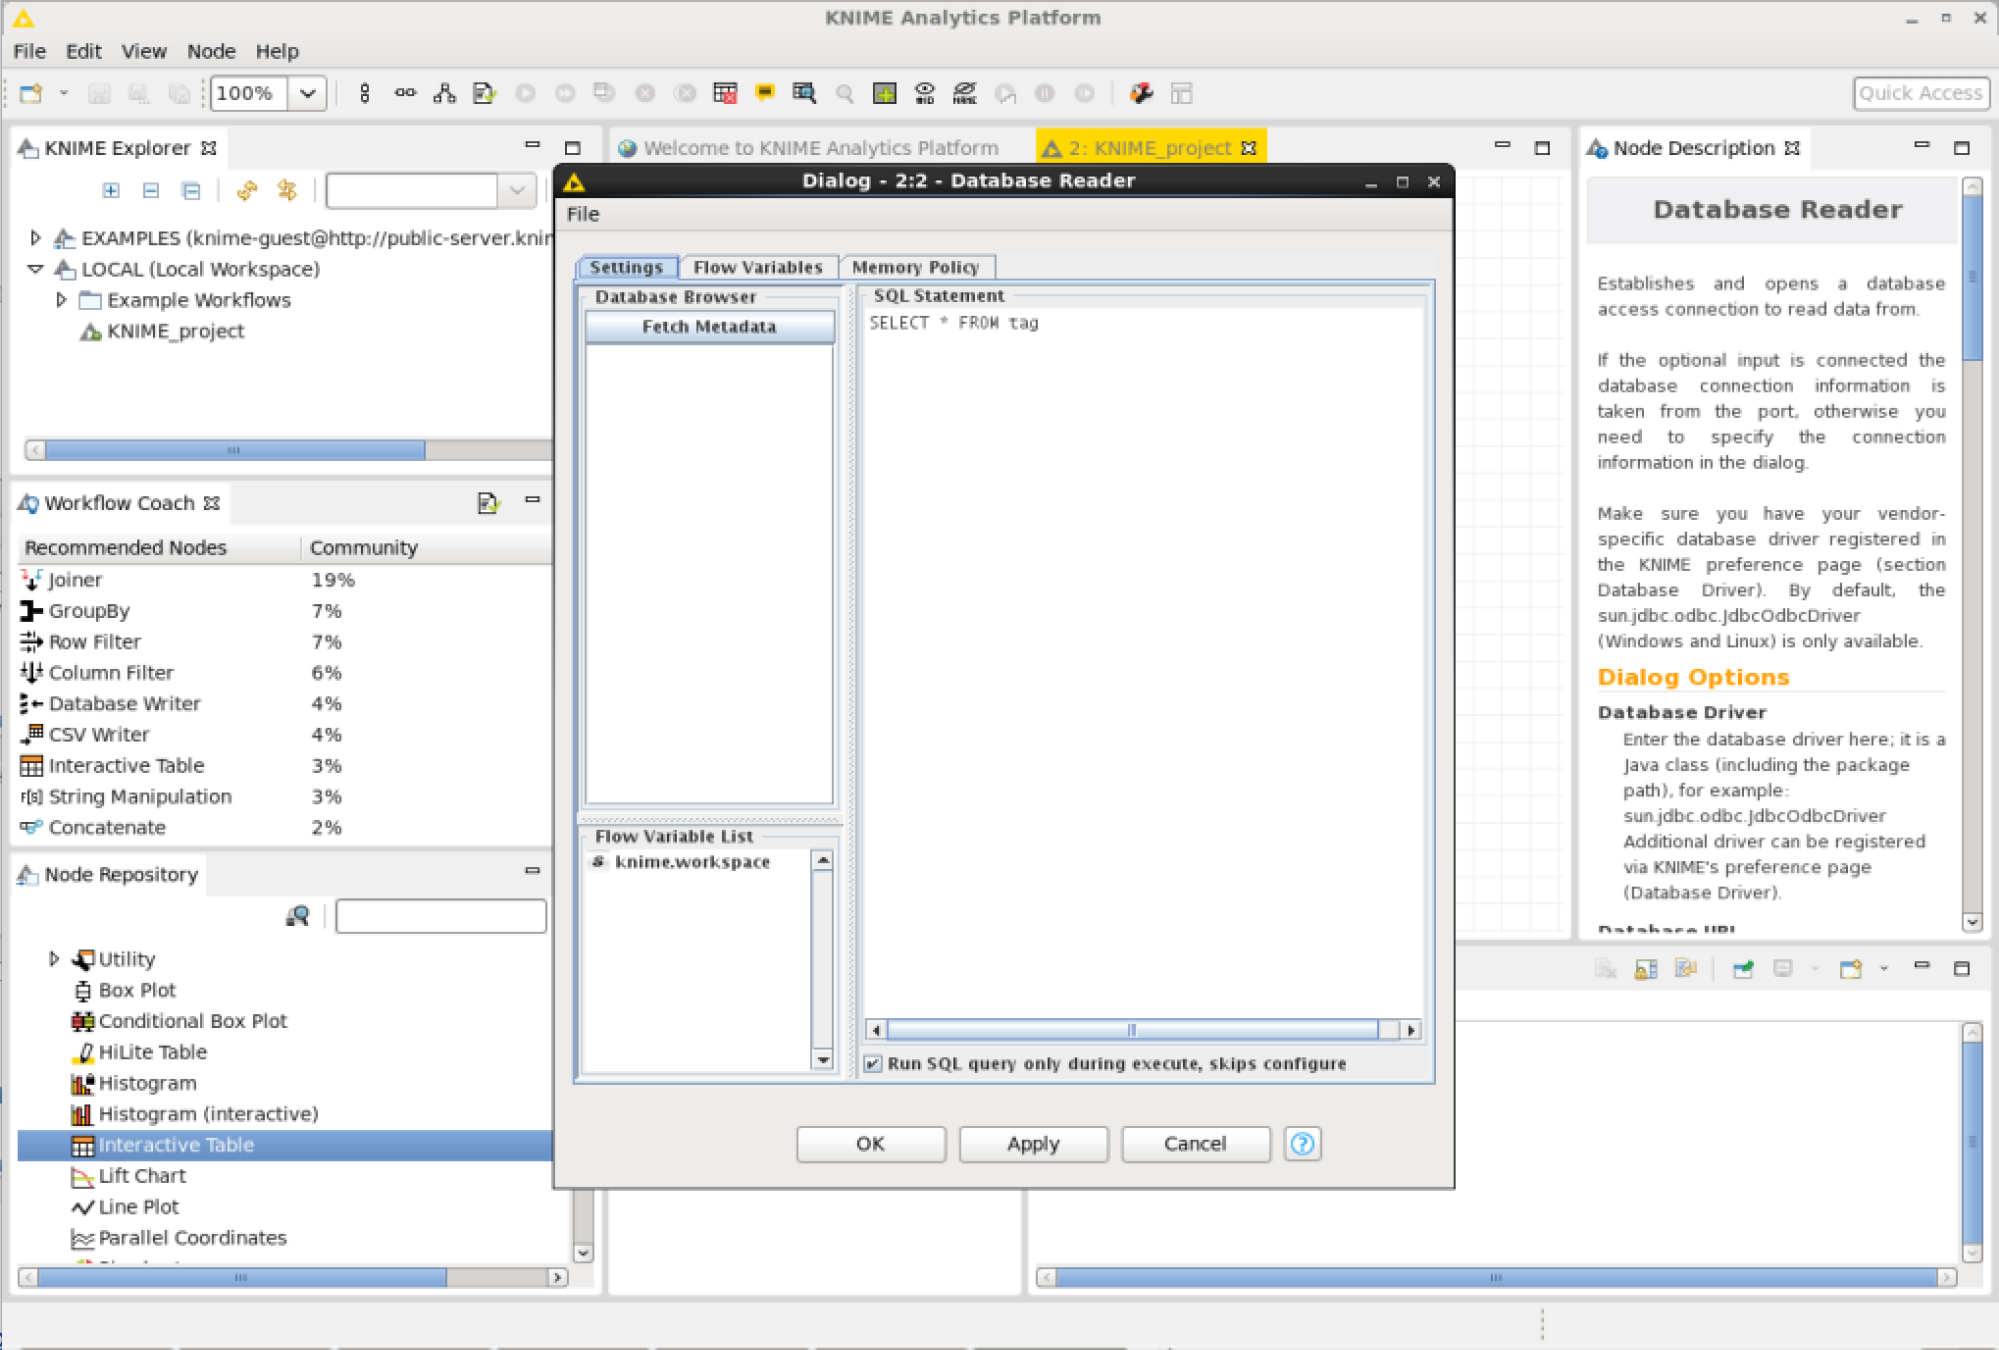
Edit the database reader node and enter an SQL query:1
select * from tag
Execute the workflow by pressing the green arrow on top.
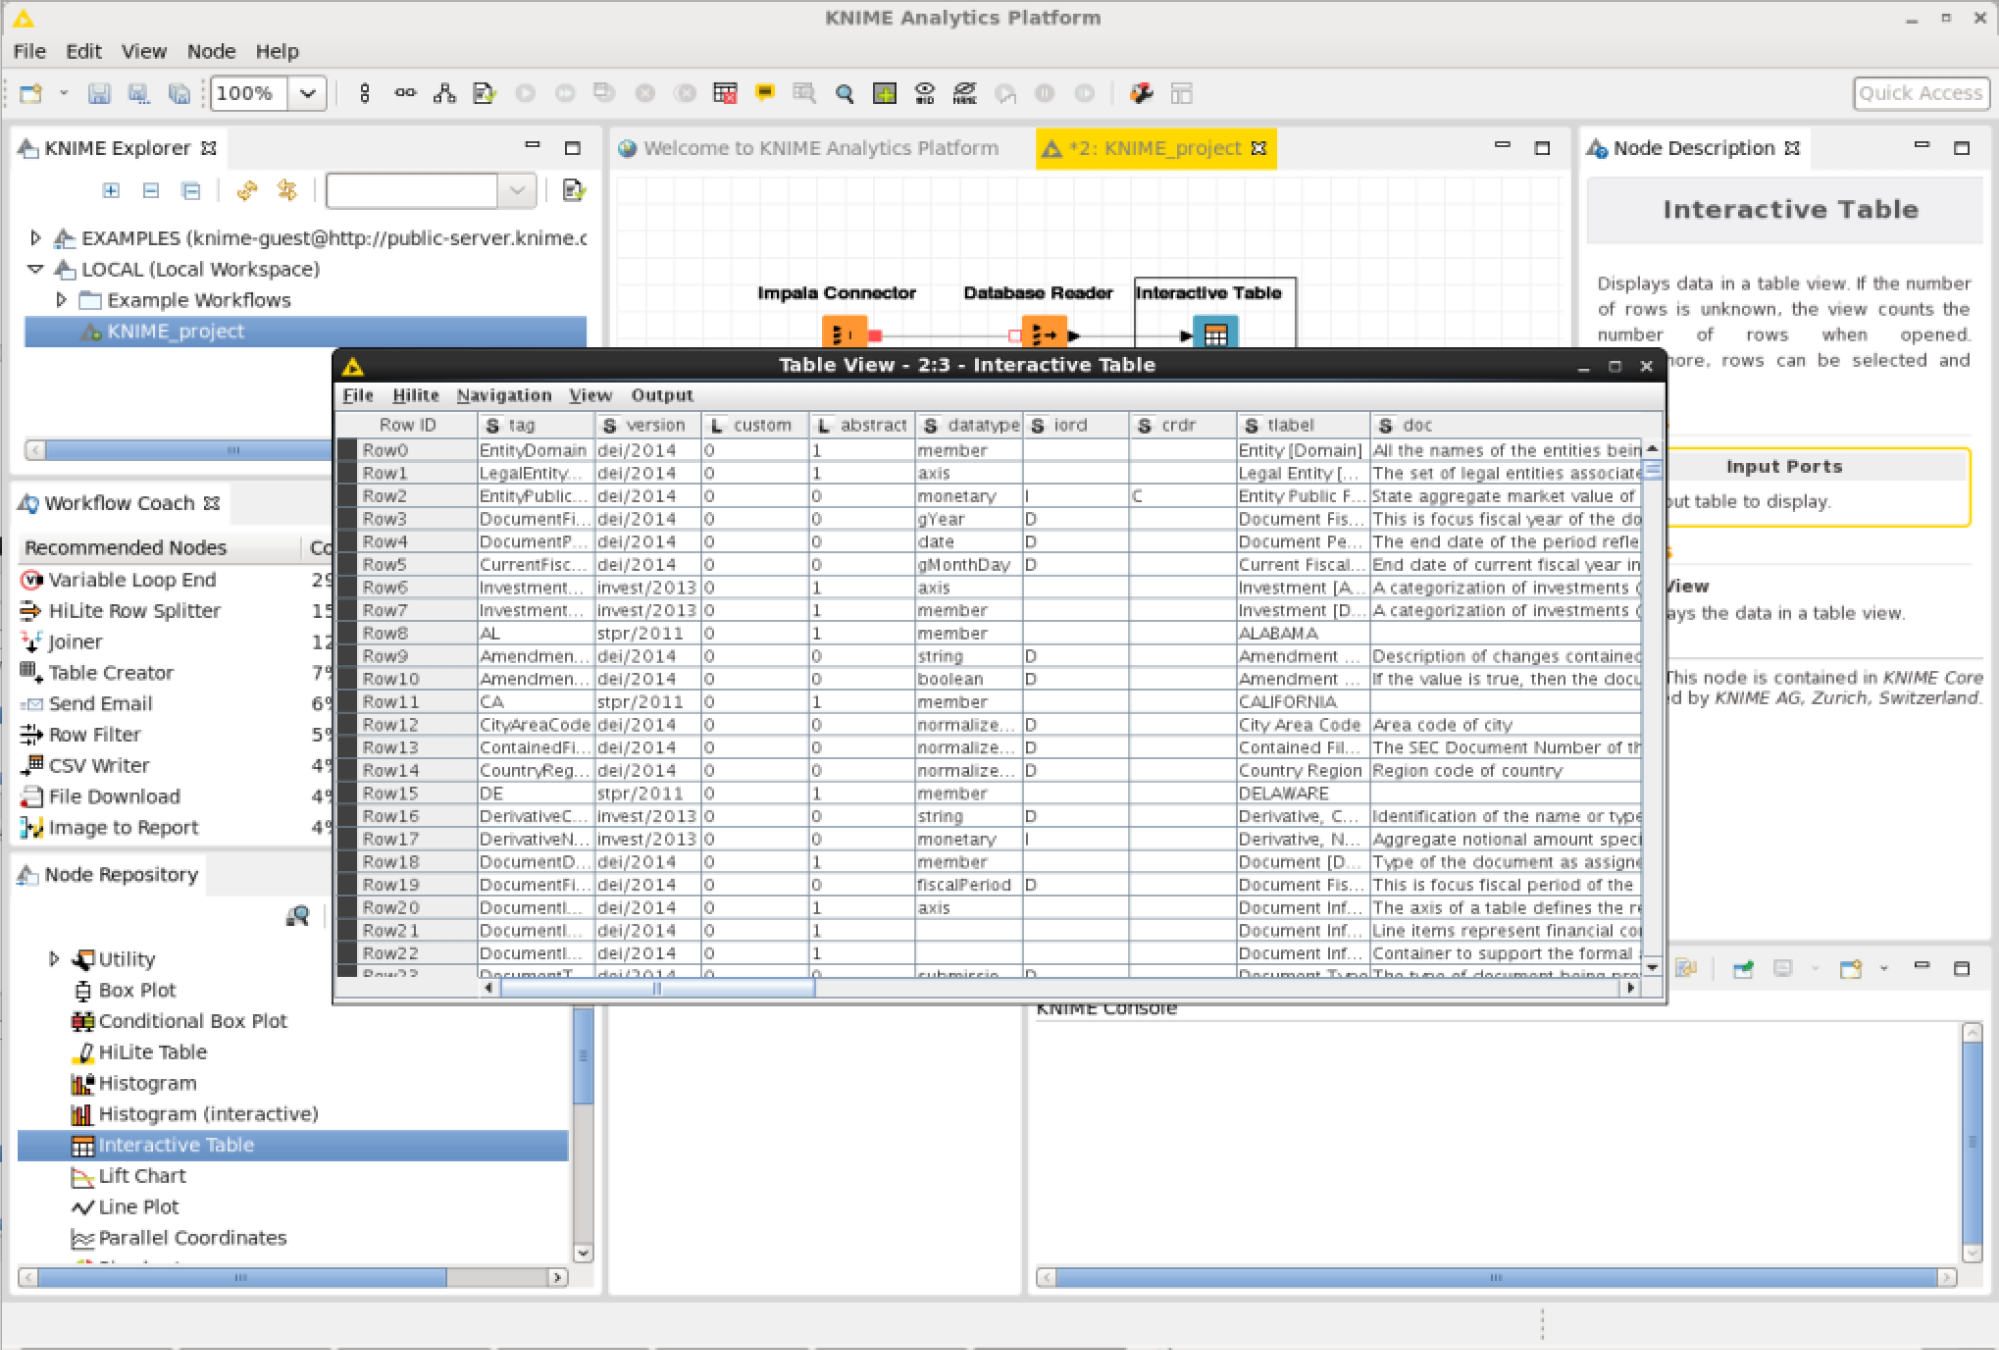
View the results stored in the interactive table node by right clicking on it and pressing “View Table View”.
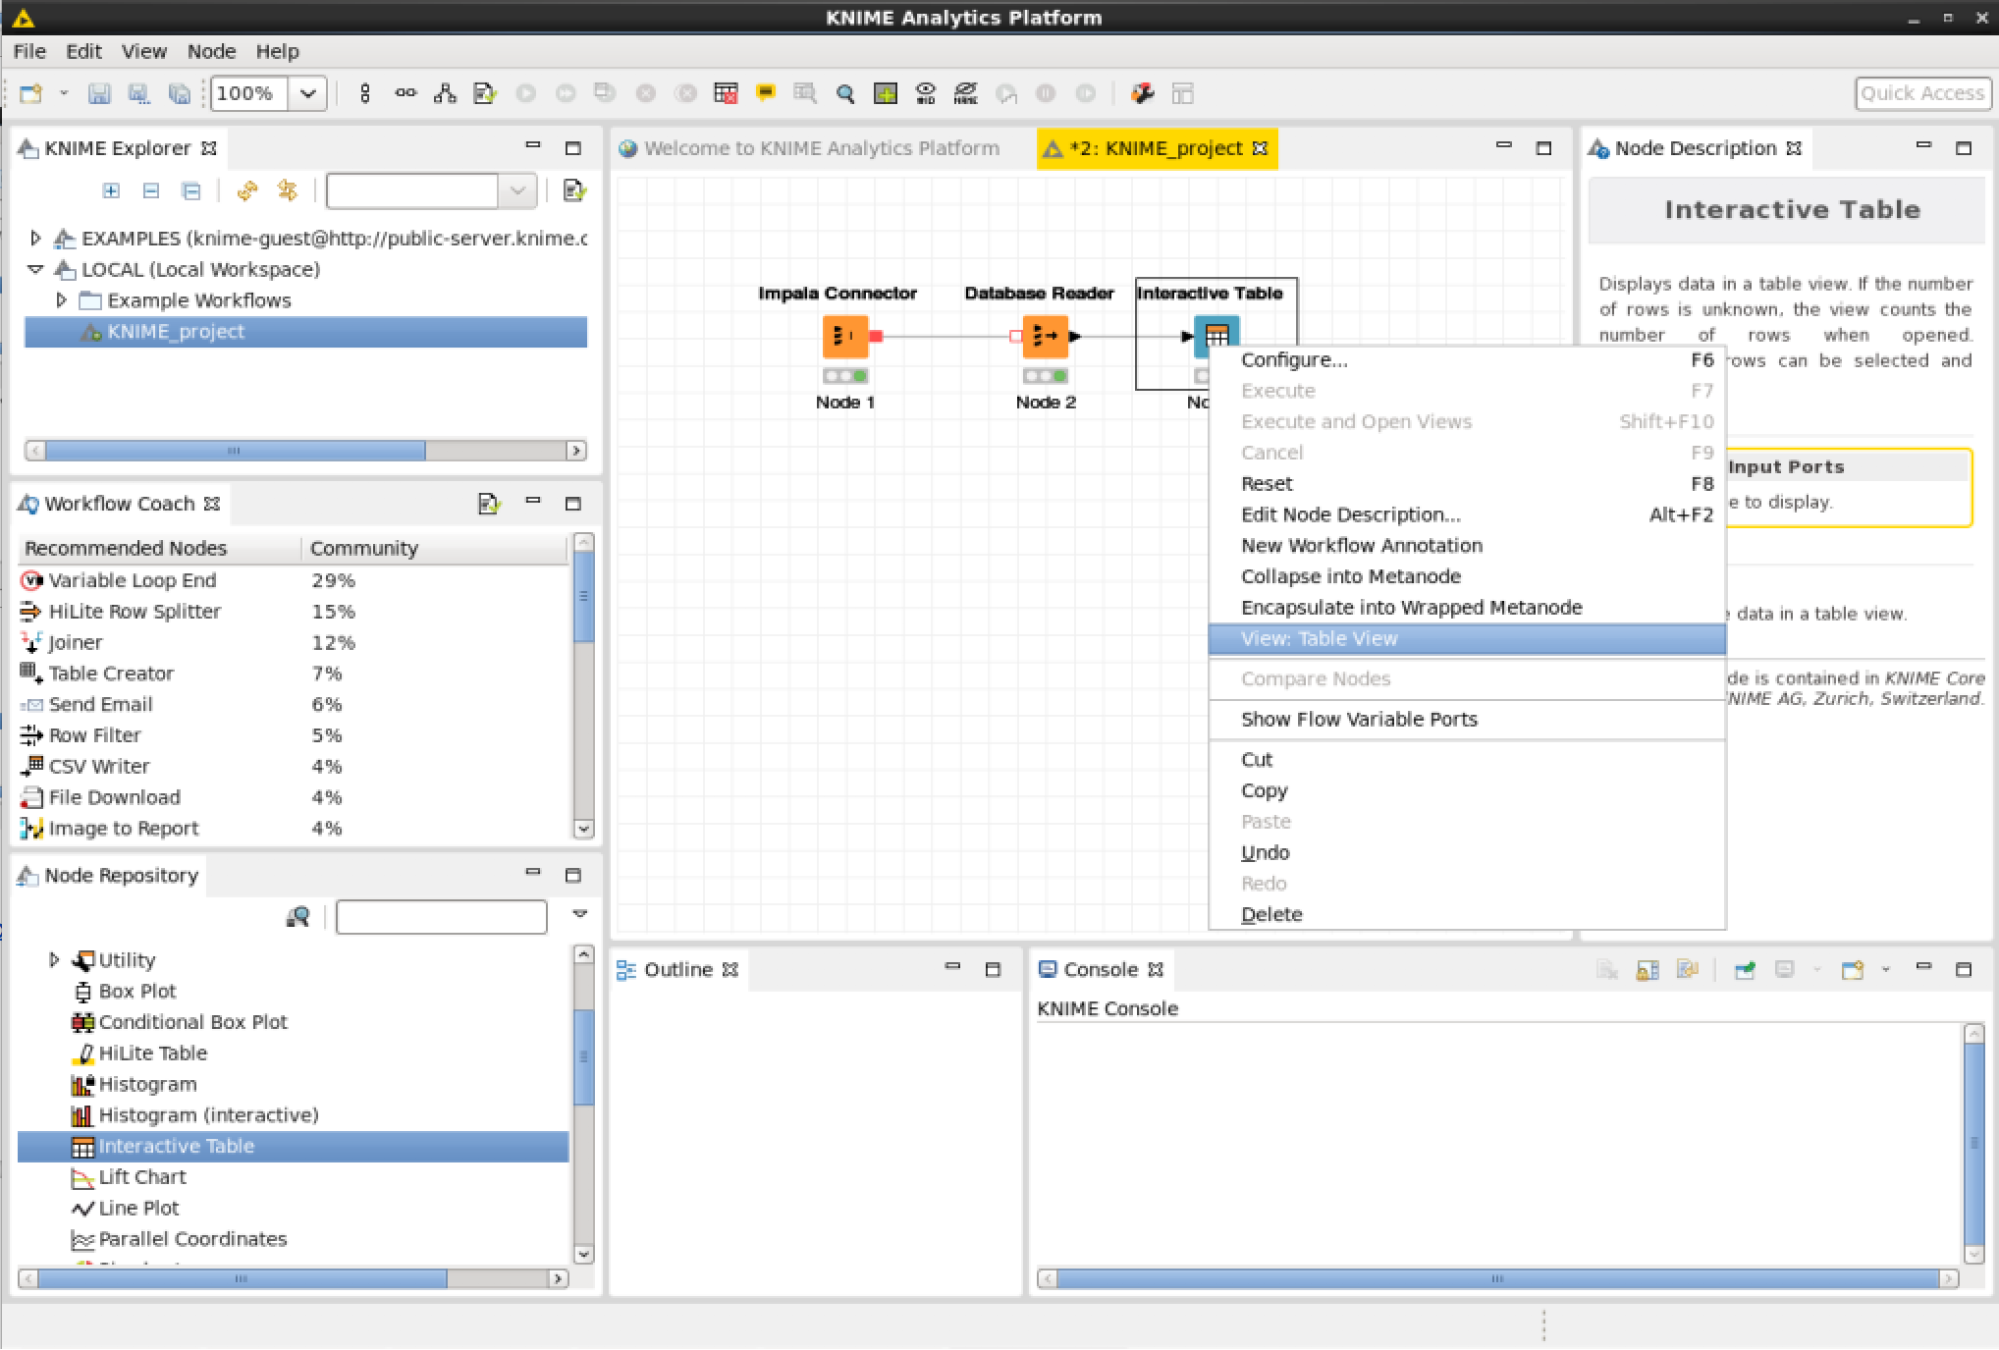
The SQL query results should be displayed in a table.
KNIME Linear Regression
Next add a node for Linear Regression.
Modify the Database Reader node and add the following SQL query:
1 | select value as y, ddate as x from sub |
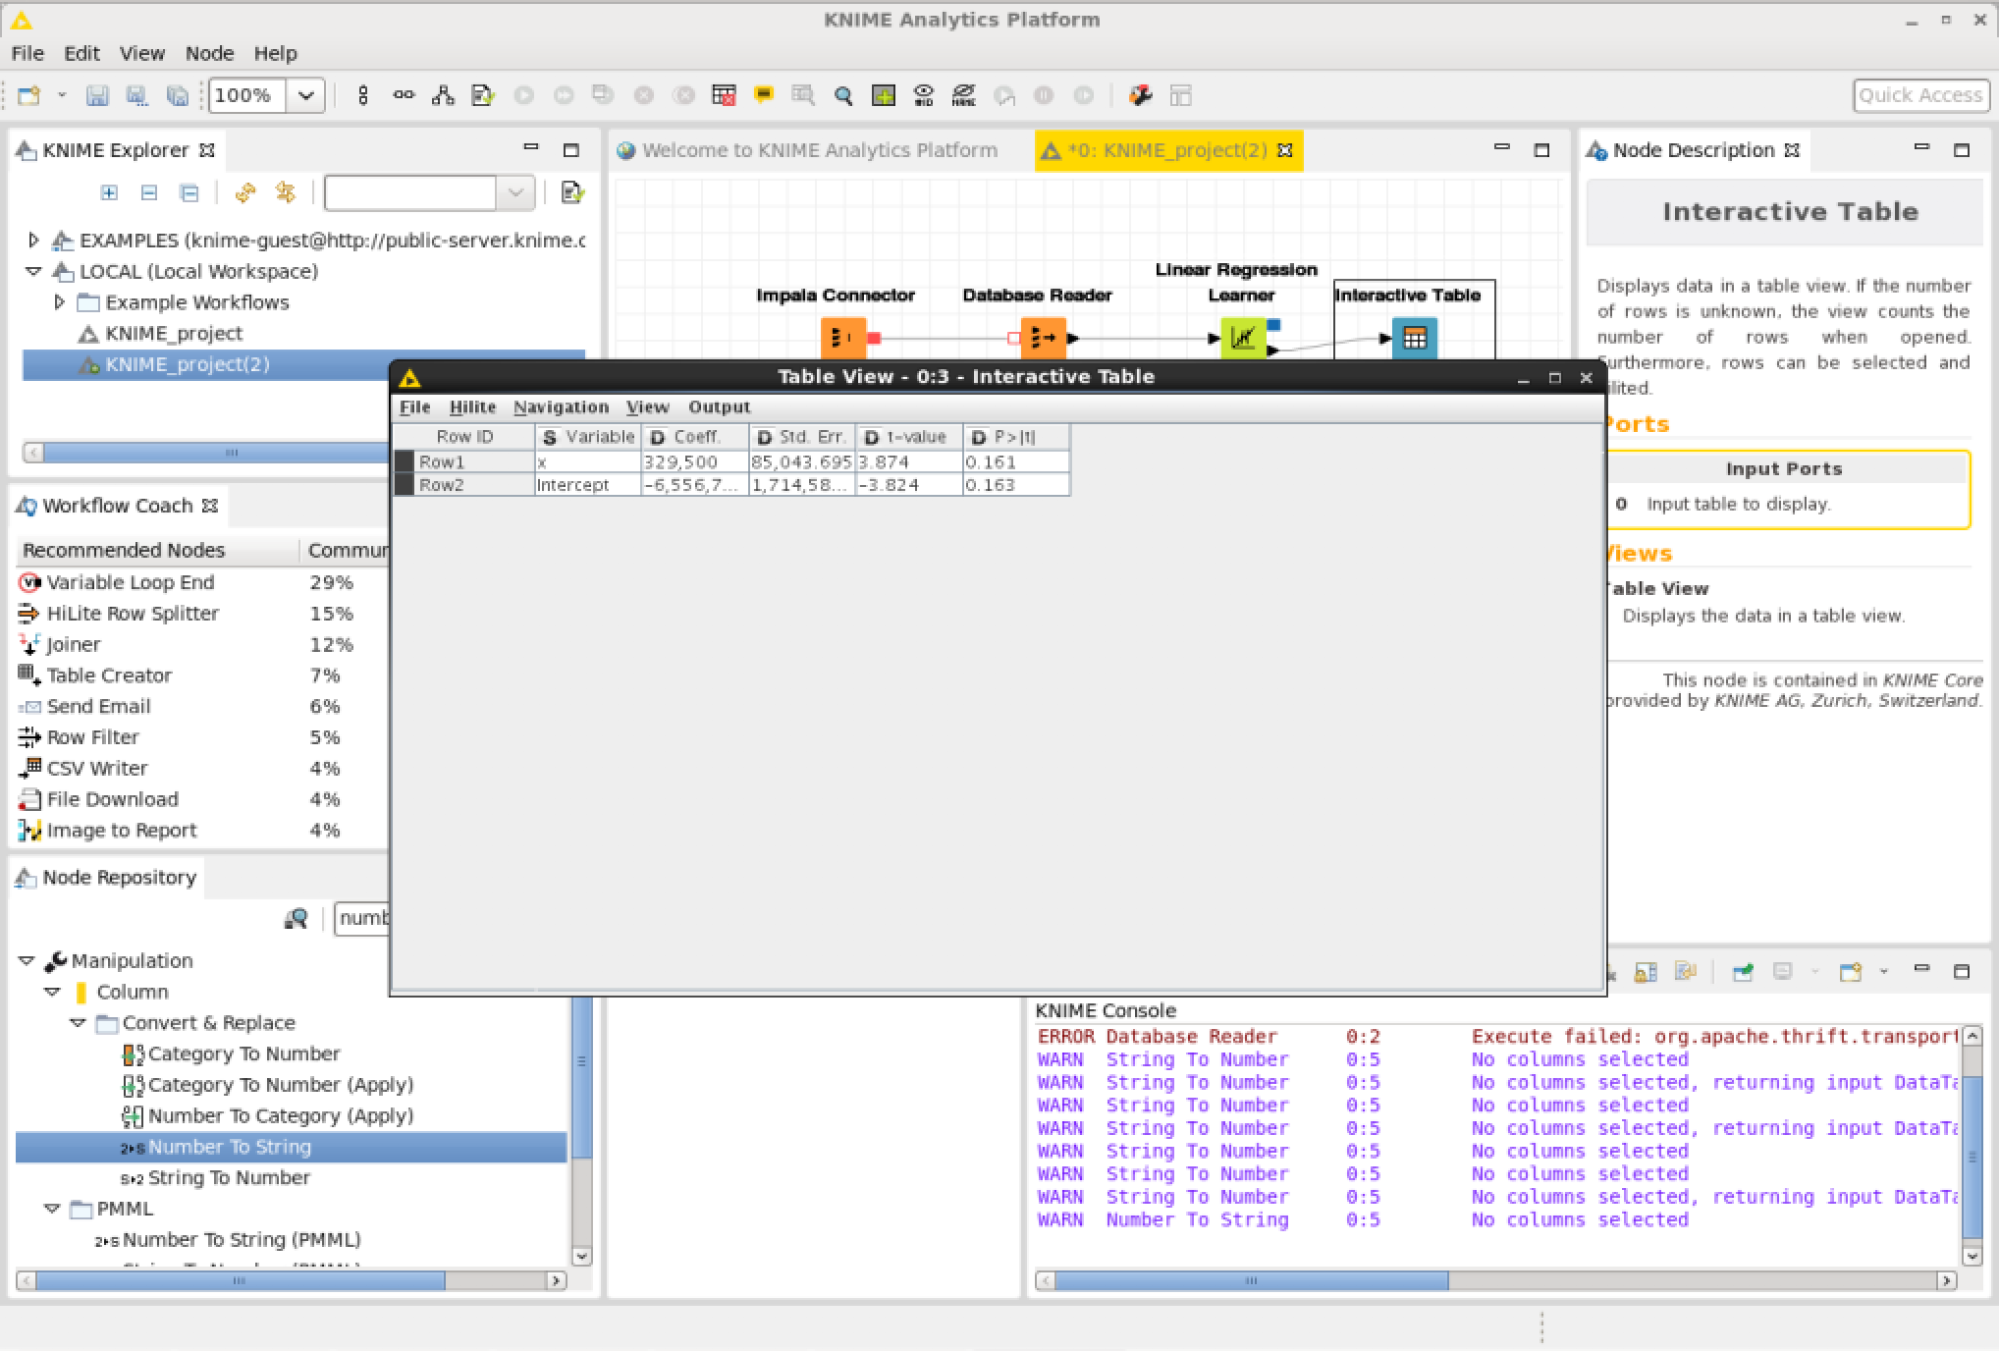
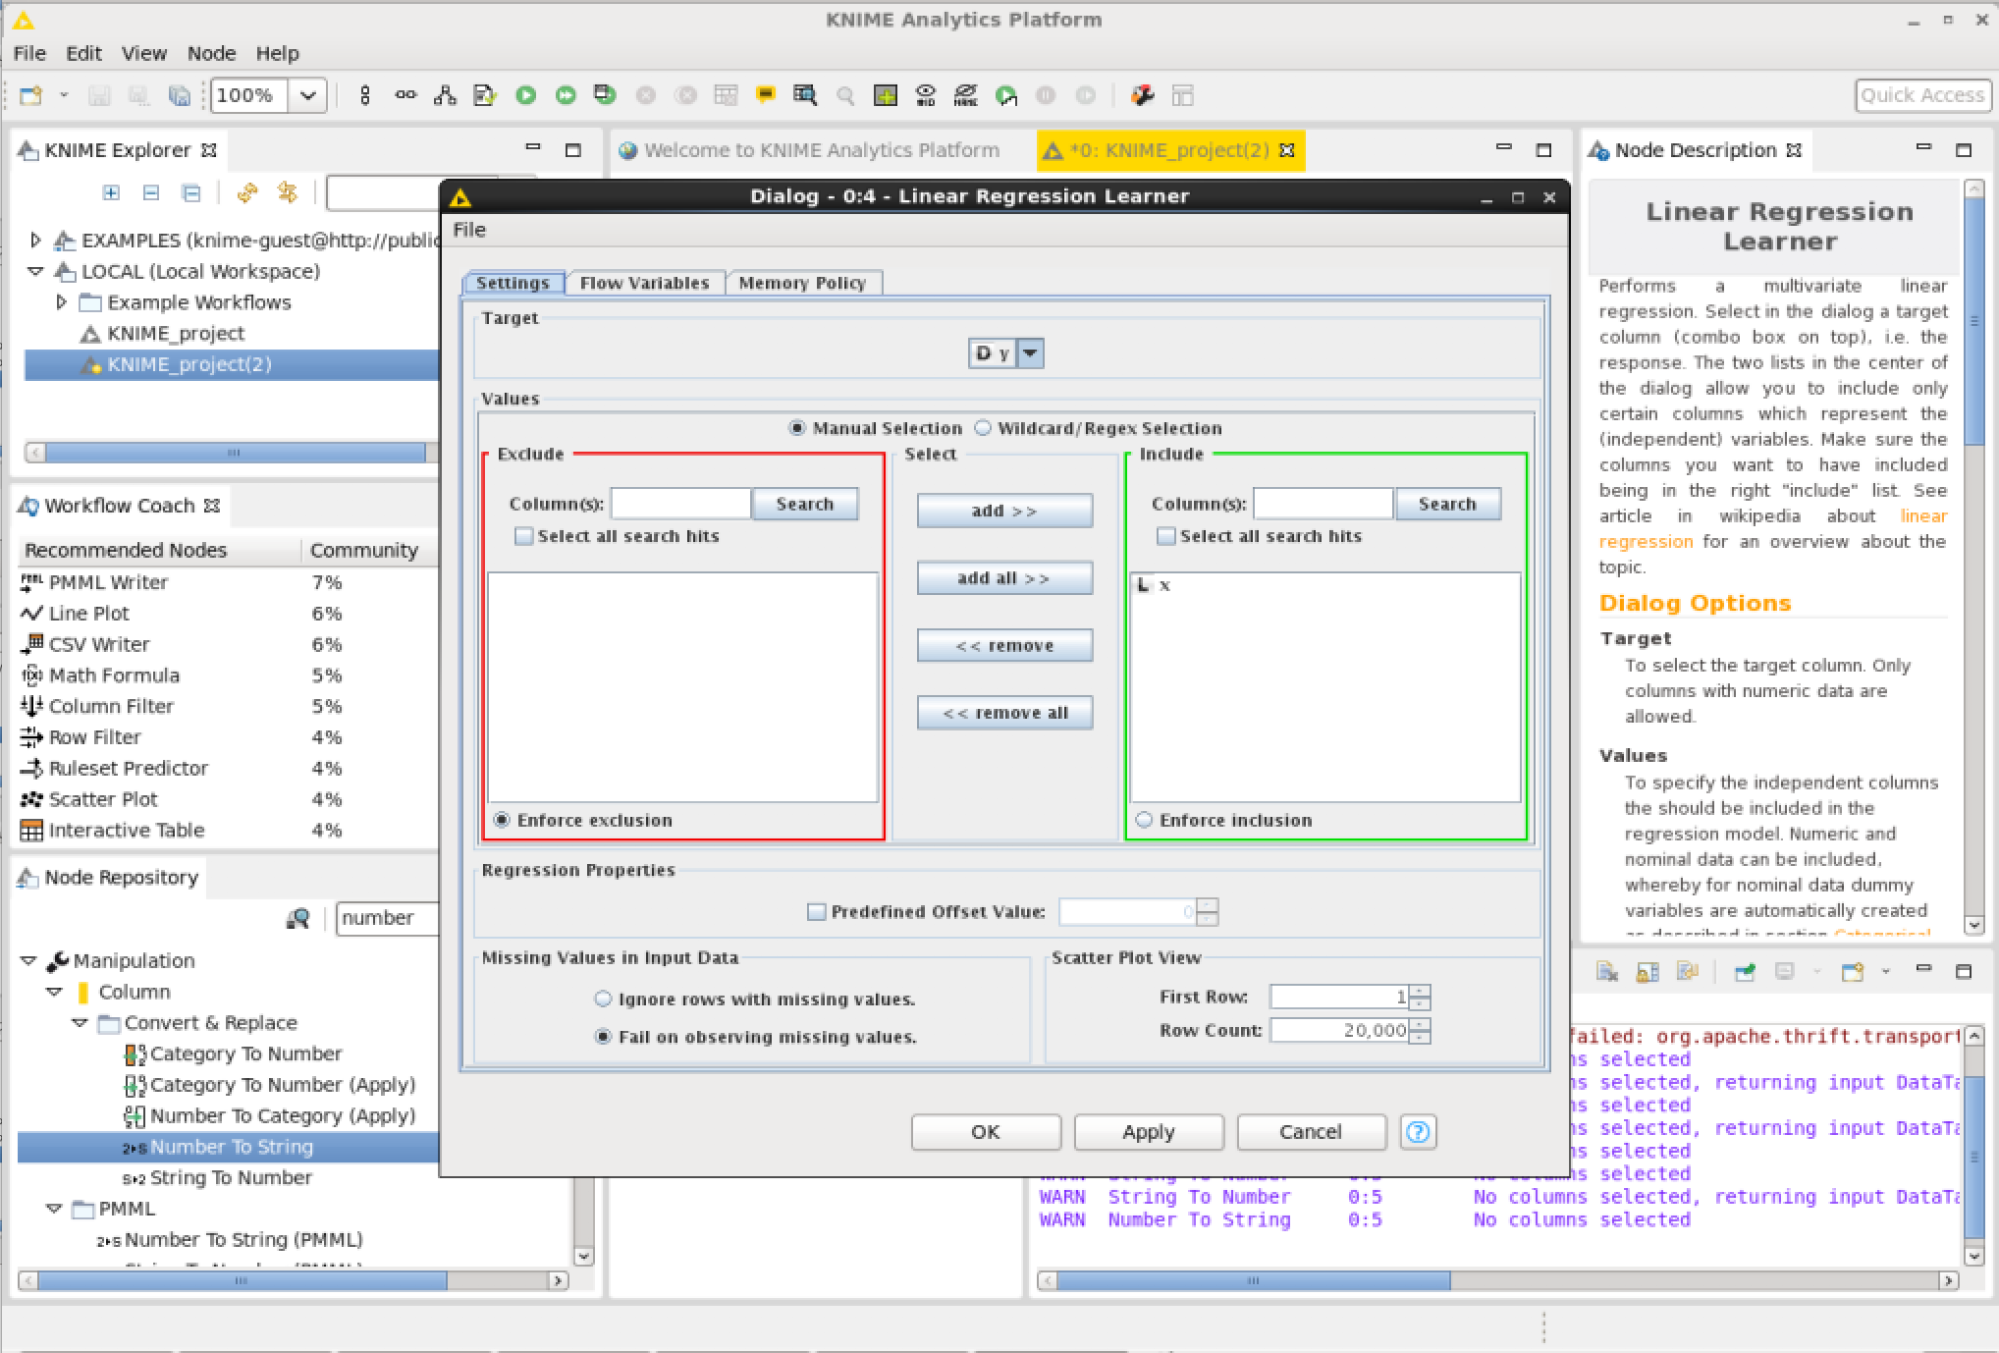
Configure the Linear Regression node. (You may not be able to see which variables to use as parameters. To populate the variables on the user interface execute all the nodes before the Linear Regression node.) In the top section called “Target” there is a drop down to select the dependent variable y. In the “Values” § “Include” section add the independent variable x.
Run all the nodes and when the execution is finished view the results in the interactive table.