Introduction
Investors are often asking the question: what is my next big investment? To answer this question investors have developed techniques for identifying good stocks. Some investors rely on tips, others rely on hard data. How can an investor use hard data to select a stock?
EDGAR
All publicly traded companies in the U.S. are required by the Security and Exchange Commission (SEC) to file registration statements, periodic reports, and other forms electronically through a system called EDGAR. All of this financial information is made accessible to the public through the EDGAR page on the SEC website.
Form Types Overview
There are several document types available through EDGAR such as 10K, 10Q, 8K, 20F, 40F, S-1 etc.The 10-K form describes the financial condition and performance of a company for an annual period. The 10-Q form reports the financial condition of a company for a quarterly period and it generally contains unaudited financial statements.
U.S. GAAP
GAAP (Generally Accepted Accounting Principles) is the accounting standard adopted by the SEC. GAAP are a set of rules that encompass the details, complexities, and legalities of business and corporate accounting. U.S. law requires businesses that release financial statements to the public and companies that are publicly traded on stock exchanges and indices to follow GAAP guidelines.
Stock Screeners
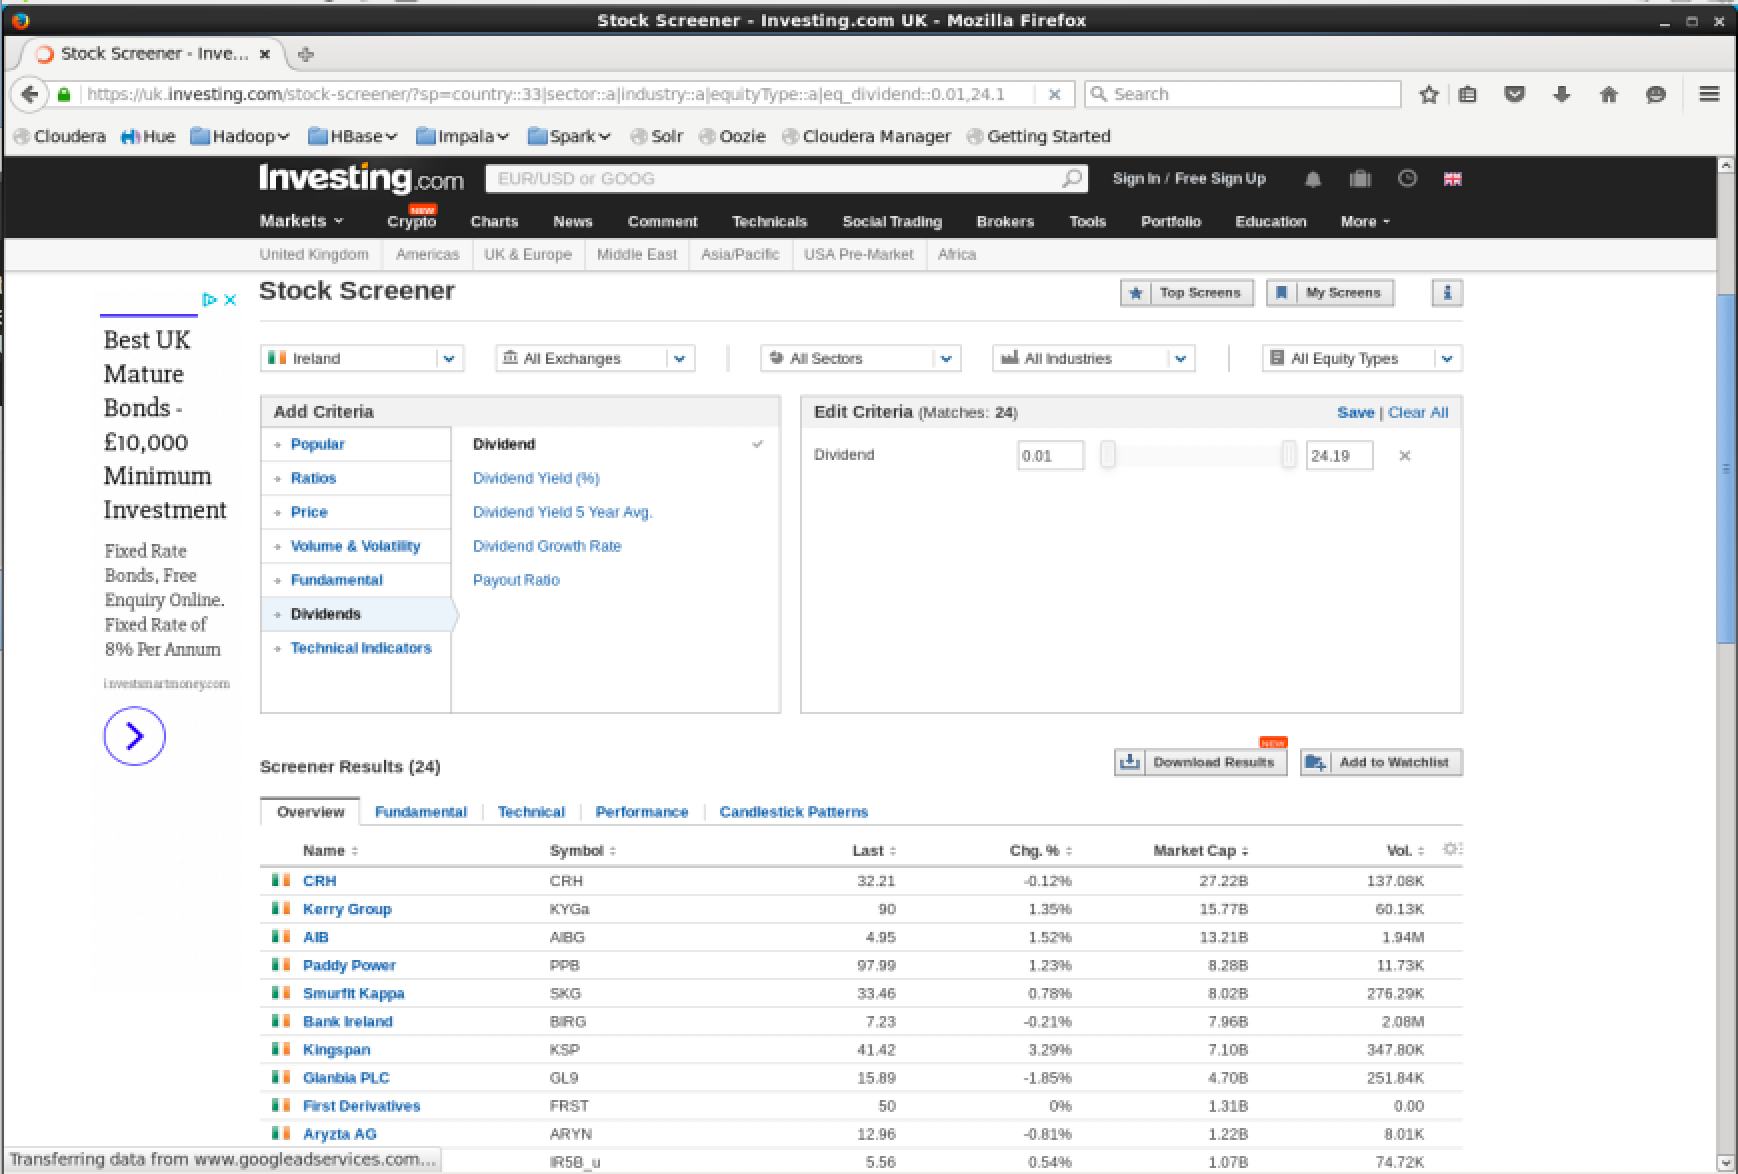
Stock screeners are specialized search engines to query financial data to help investors filter stocks based on a search criteria. Screeners contain common pre-written queries for ratios between fields in a companies accounts. Screeners allows investors to cut down the vast number of traded stocks to a small number that meet a specific criteria. Free screeners are available online but are limited in the types of queries that can be run and are normally limited to the most recent financial period. Screeners that allow investors to build complex queries against historical data usually charge a fee to use.
XBRL Document Format
The EDGAR submissions are given in eXtensible Business Reporting Language (XBRL) tagged document format. The tagging is done using the latest XBRL taxonomy developed by the Financial Accounting Standards Board (FASB) and which is accepted by the SEC. This means all data found on EDGAR can be automatically queried using widely agreed upon reference codes.
Data Sets
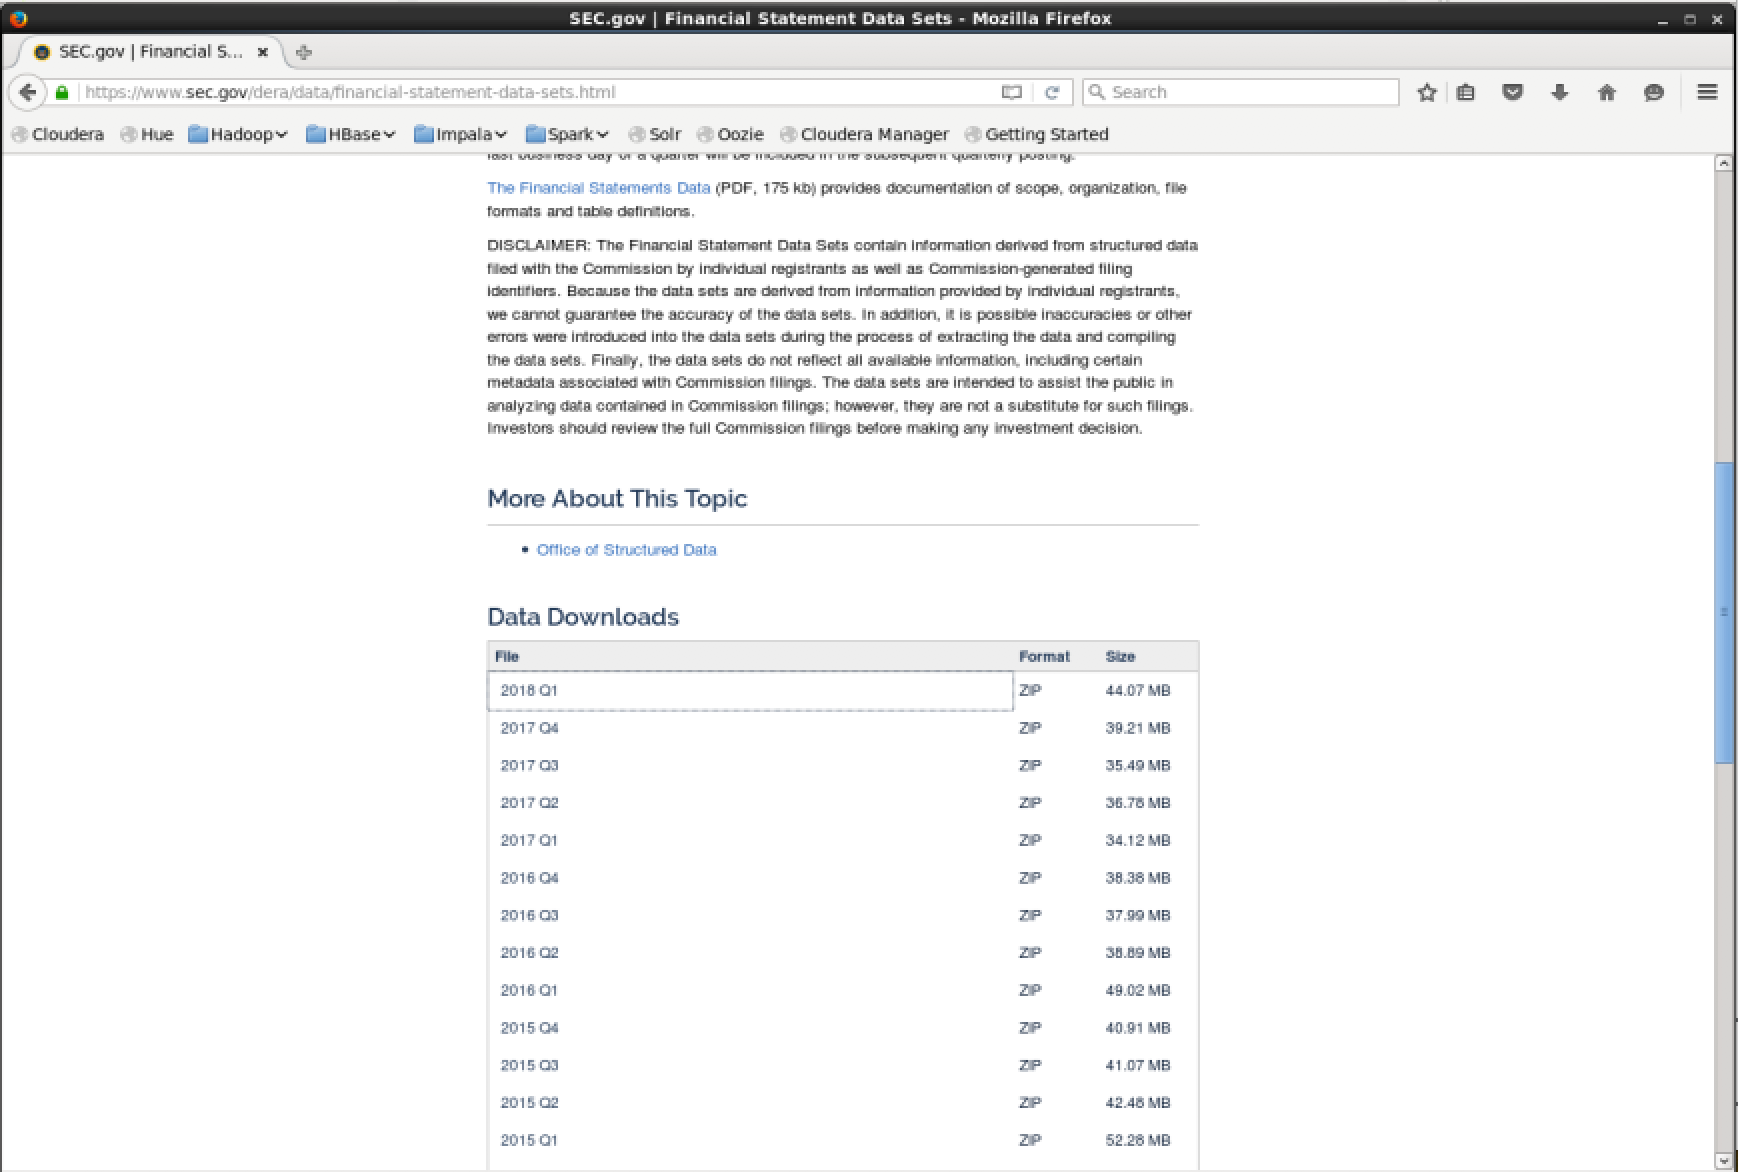
The SEC has made all XBRL submissions since 2009 available to download on their website. The information is presented without change from the “as filed” financial reports submitted by each registrant. The data is presented in a flattened format to help users analyze and compare corporate disclosure information over time and across registrants. The XBRL data is provided in a flattened data format to assist users in more easily consuming the data for analysis. The data is published on a quarterly basis in a zip file. Inside each zip file is a README file plus 4 data tables in tab-delimited CSV. The files are linked together with foreign-keys.
- readme.htm - general information describing the dataset
- sub.txt - Submission data set; this includes one record for each XBRL submission
- num.txt - Number data set; this includes one row for each distinct amount from each submission included in the SUB data set.
- tag.txt - Tag data set; includes tag definitions, descriptions (documentation labels), taxonomy version information and other attributes
- pre.txt - Presentation data set; this provides information about how the tags and numbers were presented in the primary financial statements
Stock price data sets
High-resolution historical stock price data is expensive to acquire and is therefore rarely shared for free. QuantQuote offers free daily resolution data for the S&P500 on its web site under the Free Data tab. The data accounts for symbol changes, splits, and dividends, and is largely free of the errors found in the Yahoo data. Note, only 500 symbols are available unlike Yahoo which provides all listed symbols.
Websites such as Yahoo Finance allow you to download historical price data for free, but there are several problems. The data is not usually of very high quality as there can be mistakes. Additionally the API’s usualy require users to search by ticker symbol.
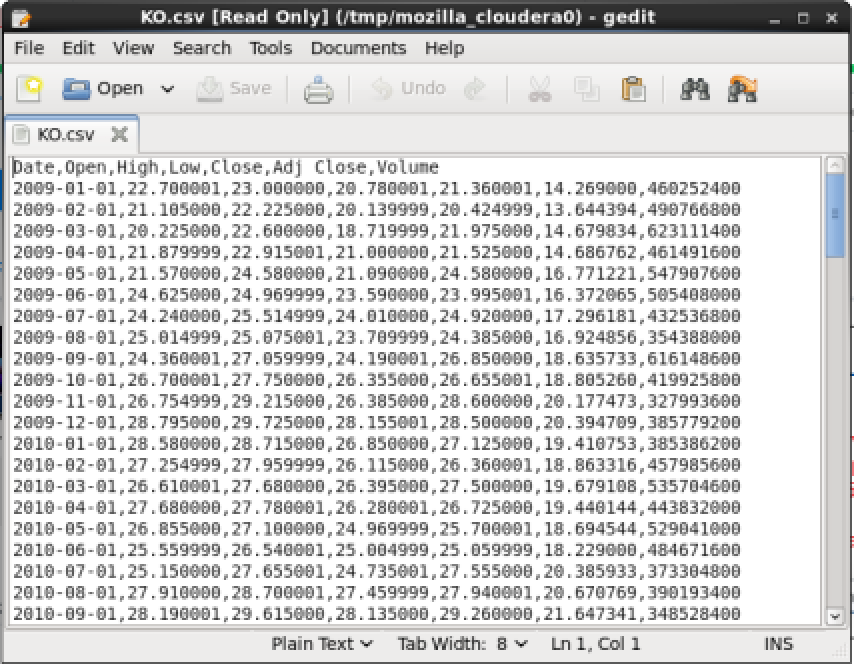
1 | $ curl 'https://query1.finance.yahoo.com/v7/finance/download/KO?period1=1230768000&period2=1529017200&interval=1mo&events=history' |
Cloudera VM
Cloudera QuickStart virtual machine (VM) include all the the open source software you need for use right out of the box including tools such as Hadoop, Spark, Hue, Impala and Hive. Hue can be used for mapping csv files to data tables in Hive. Impala can then be used to query data in Hive. This can be quickly configured in a few clicks and will allow you to run complex SQL queries against the data.
Step 1: Download the data
Open Cloudera VM
Open firefox
Download a financial data set zip file from the SEC website
Step 2: Import the data
Extract the zip file
Navigate to the Hue web application http://localhost:8888/hue/ and log in with the default username “cloudera” and password “cloudera”
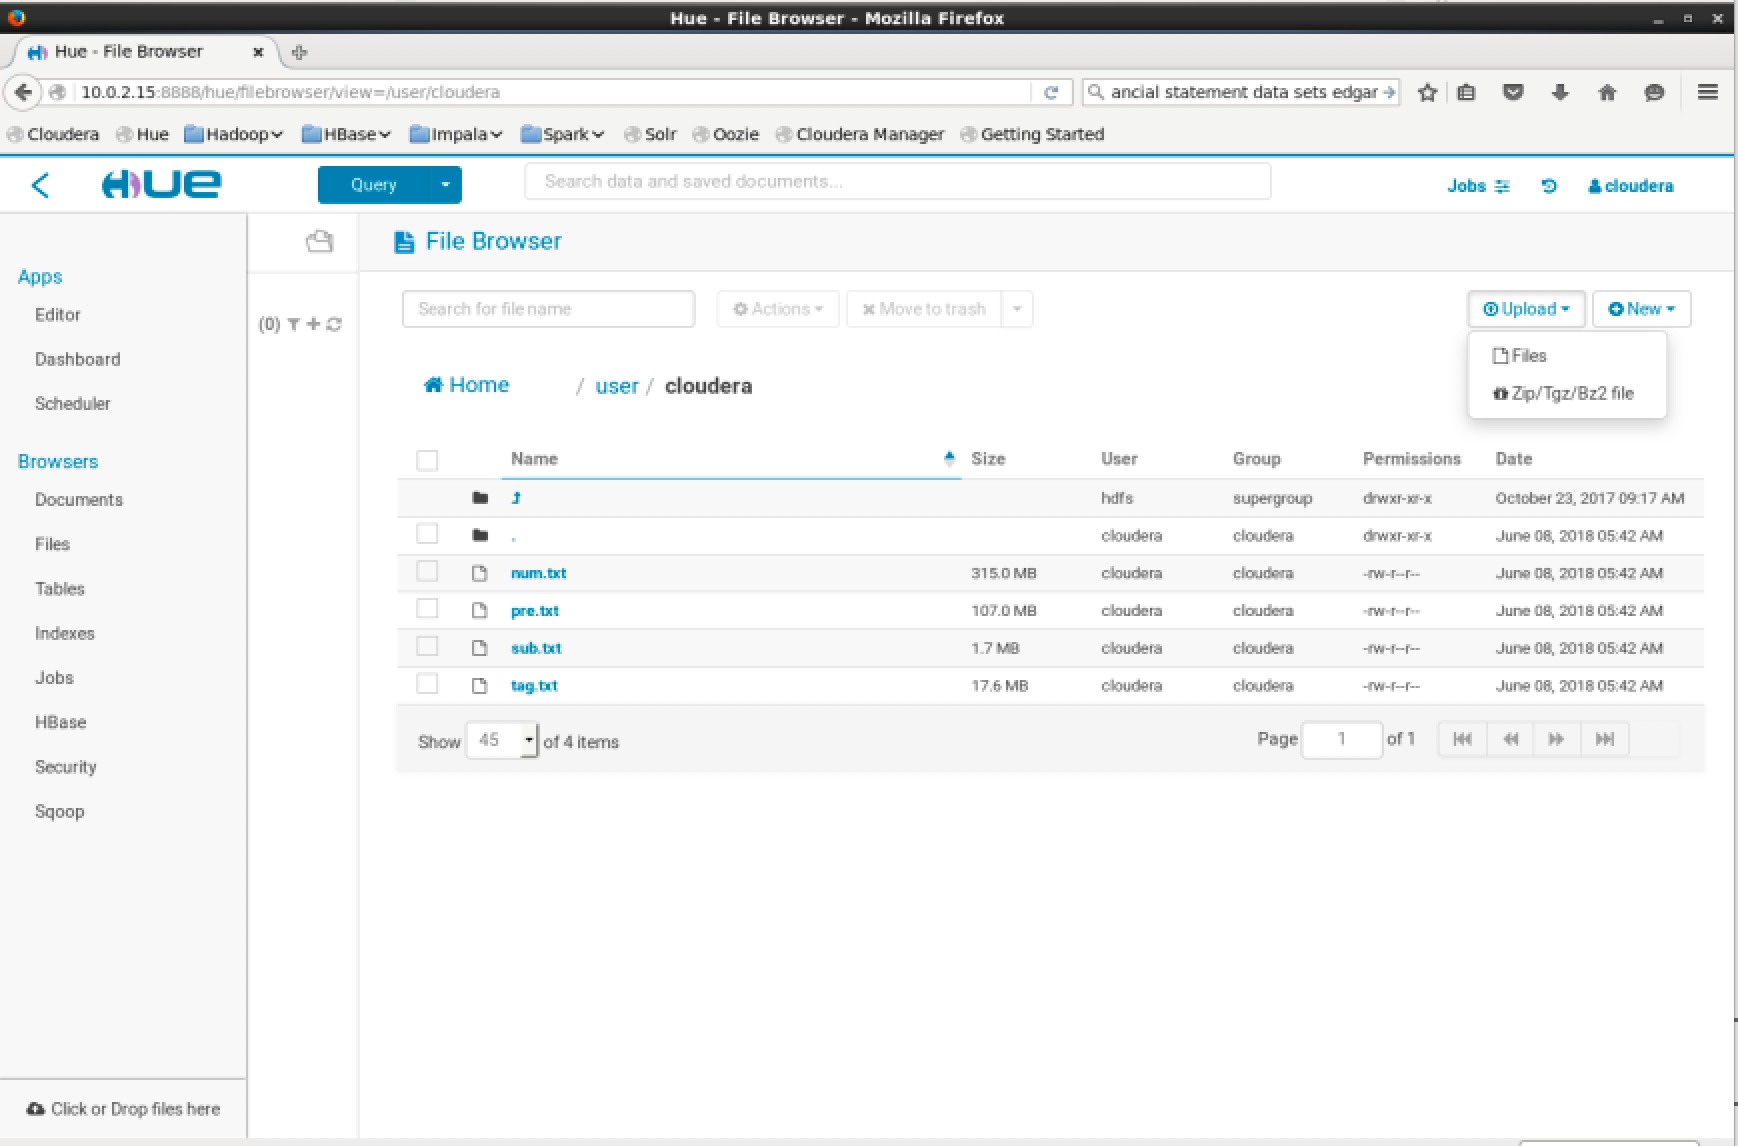
In Hue on the top left press -> hamburger menu -> Browsers -> Files -> Upload -> Files -> Select Files
Select all the txt files you downloaded previously and upload them.
Step 3: Create a table
Before importing the files you will need to modify the HDFS folder permissions to import the files to a table. To do this open the command prompt and execute the following command.
1 | $ hdfs dfs –chmod -R 666 hdfs://localhost:8020/user/cloudera/ |
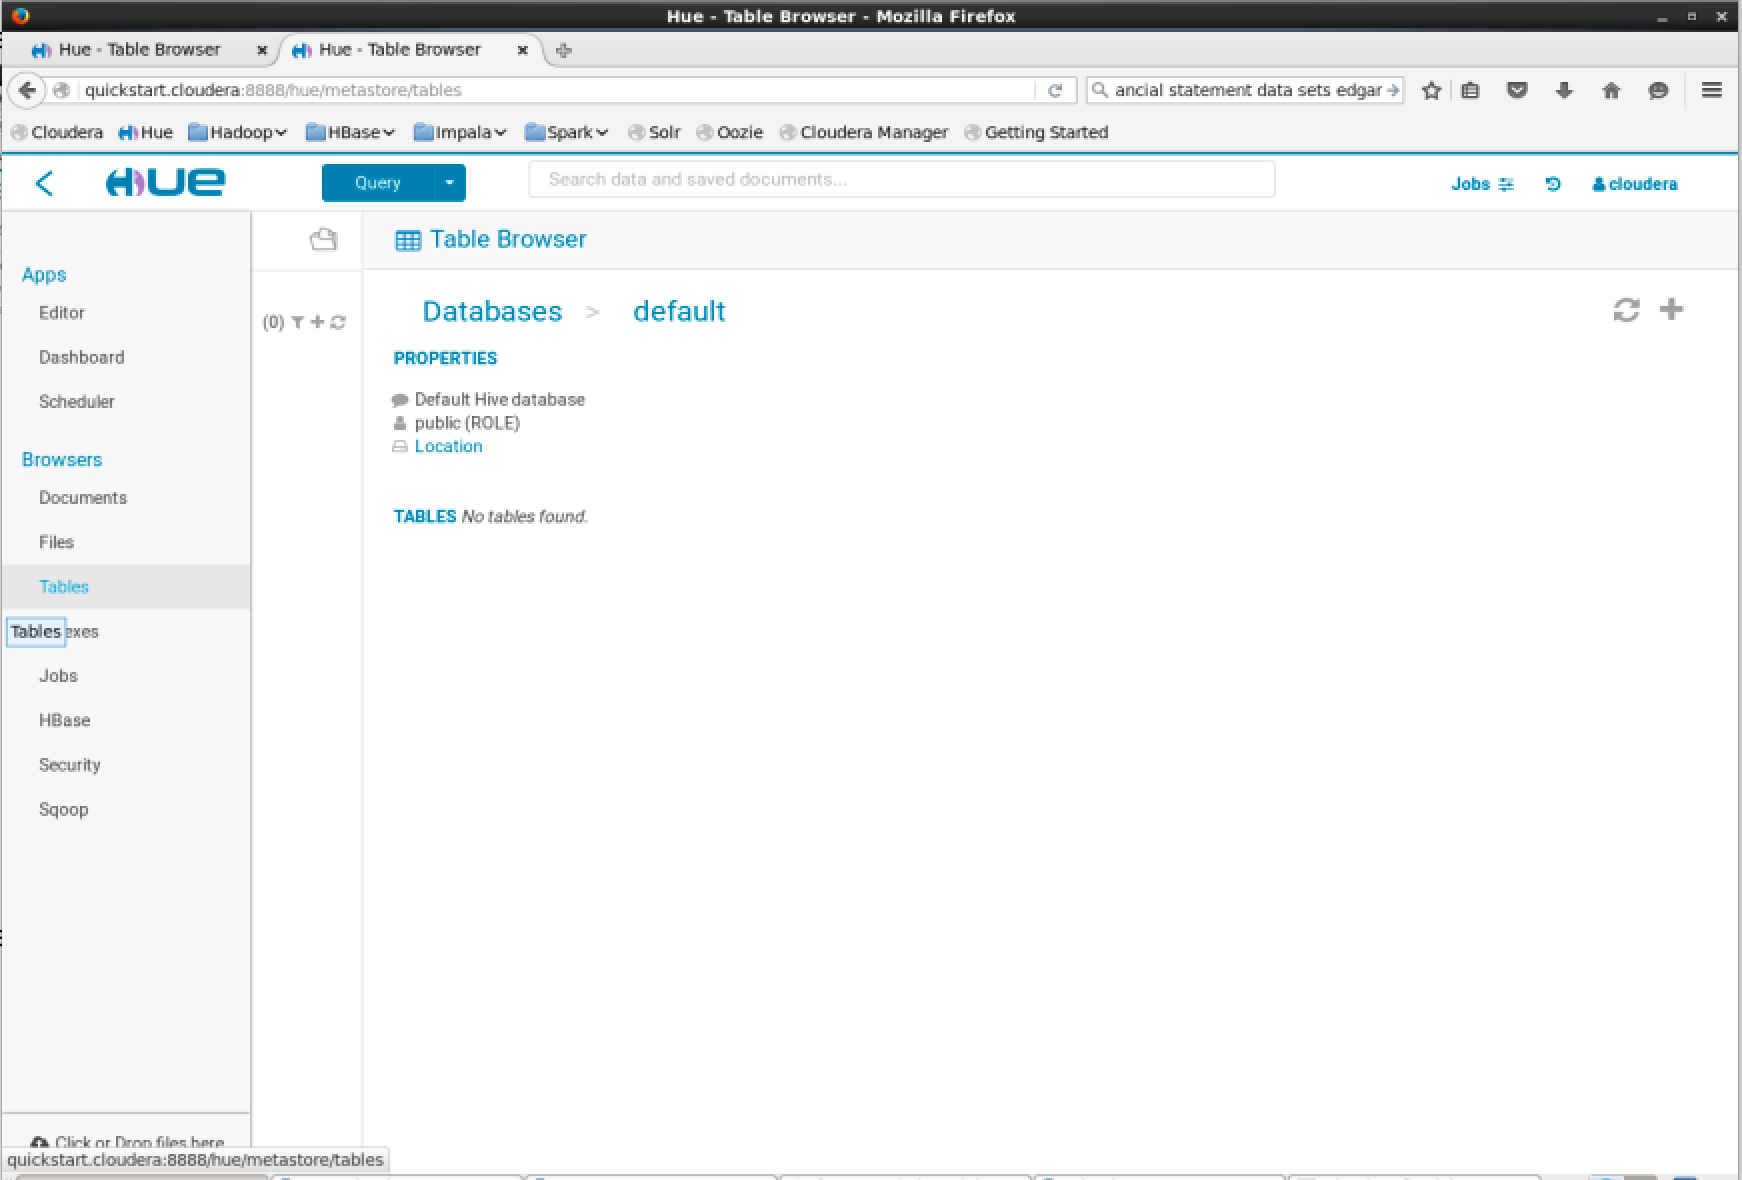
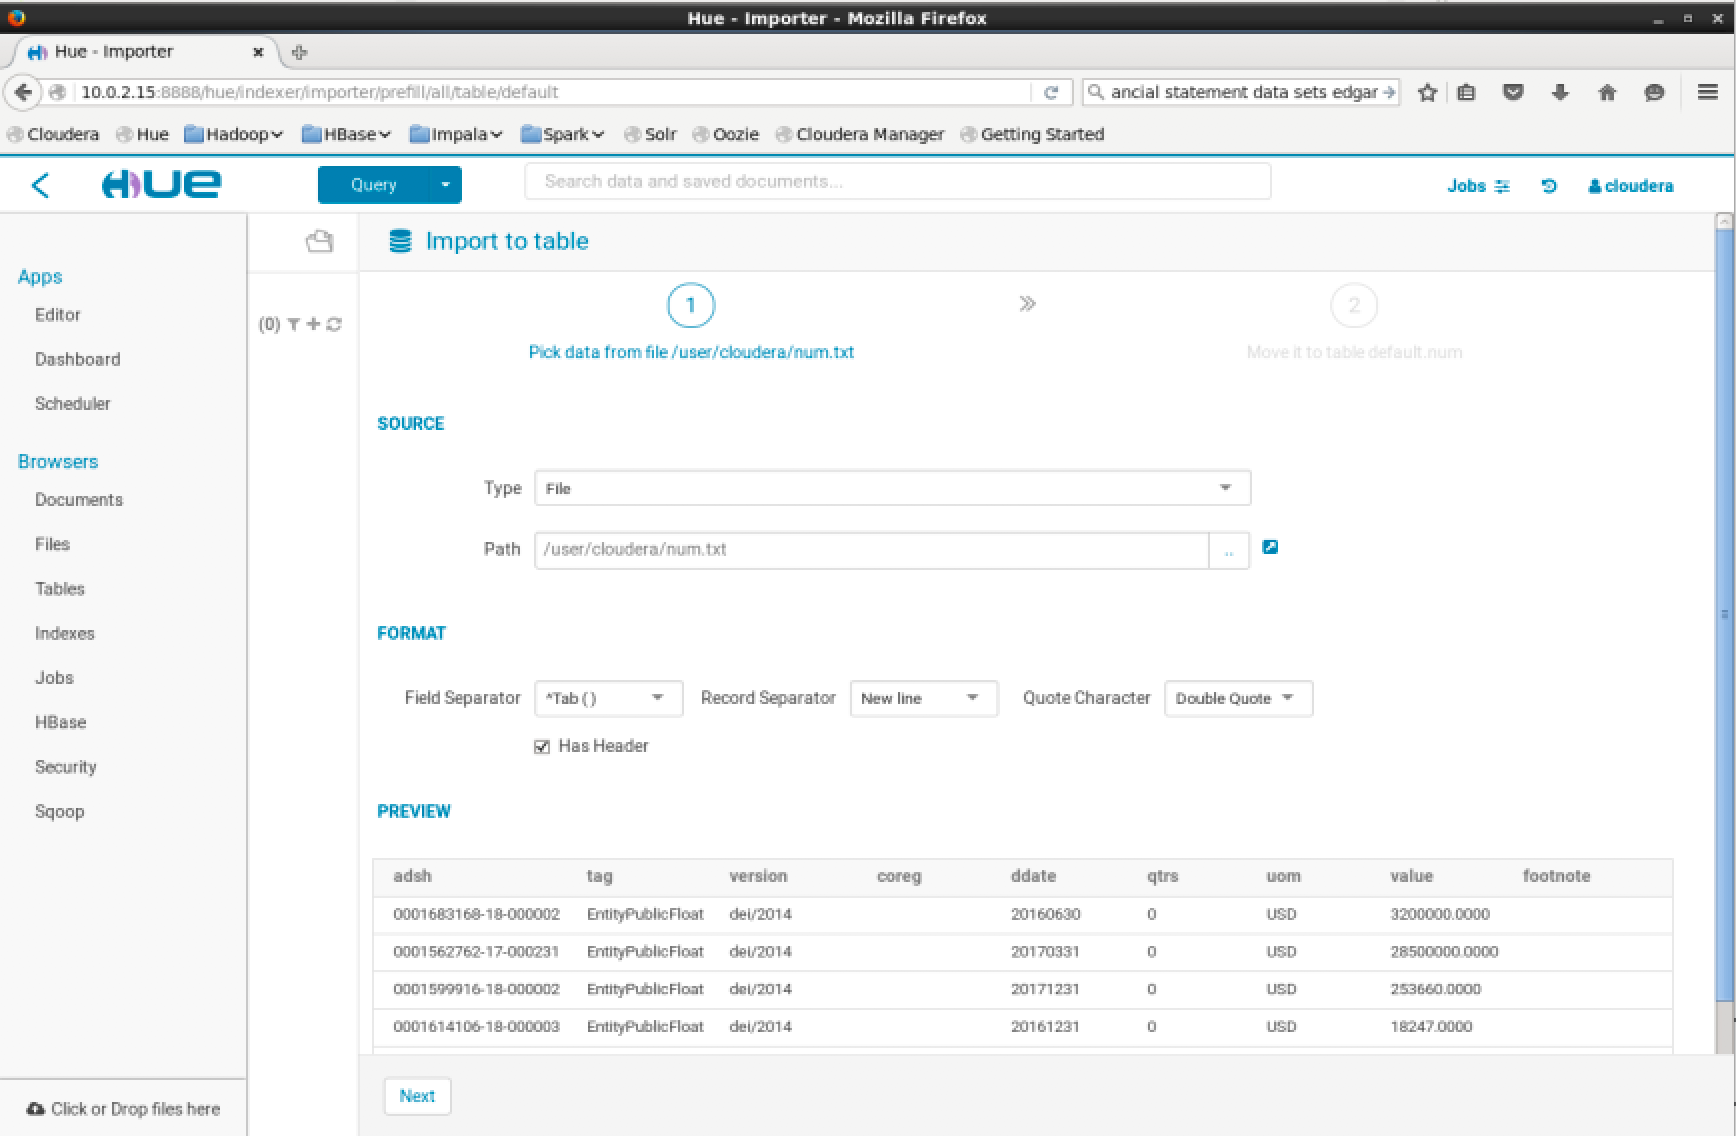
You can now progress to import the files to a table. In Hue on the top left press -> hamburger menu -> Browsers -> Tables -> Plus Icon (+)
Then set “Type: File” and “Path: /user/cloudera/num.txt”
Then press “Next”
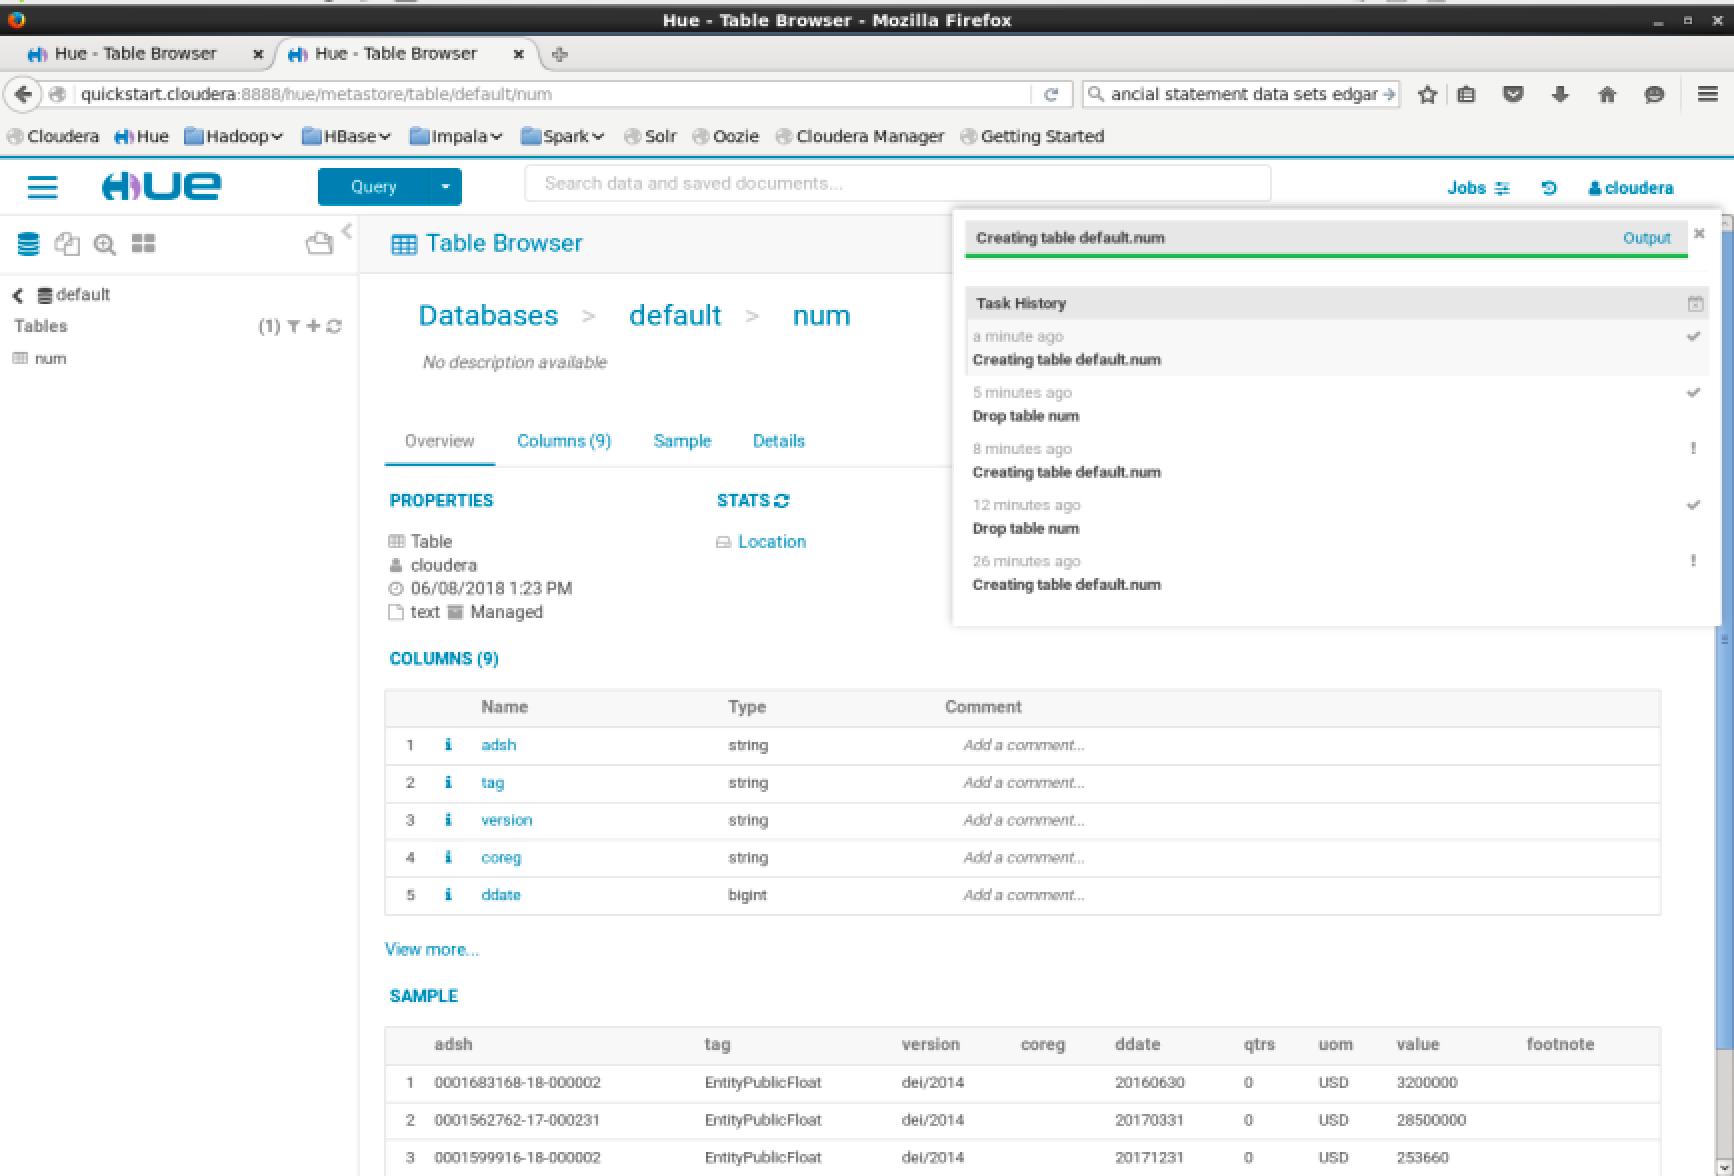
Then leave the default data types detected for the columns and press “Submit”
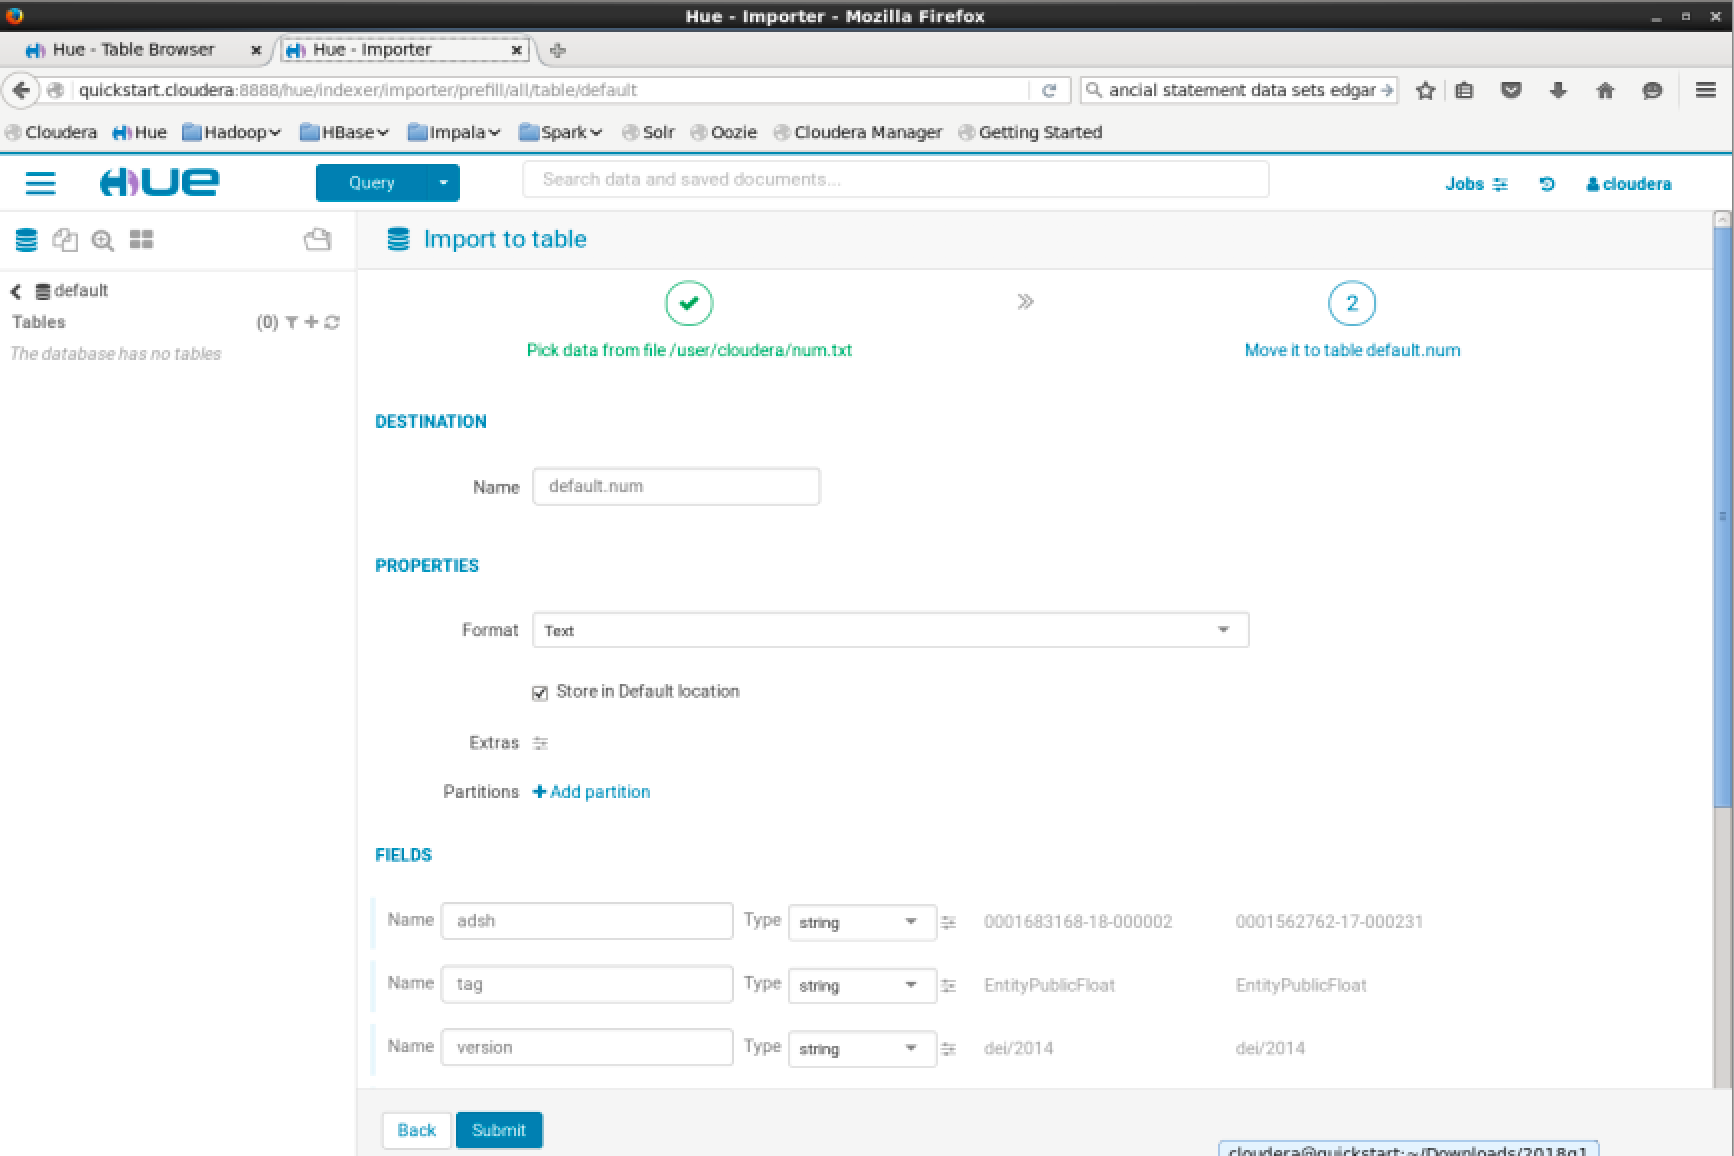
Then the table will be created and will appear on the left pane
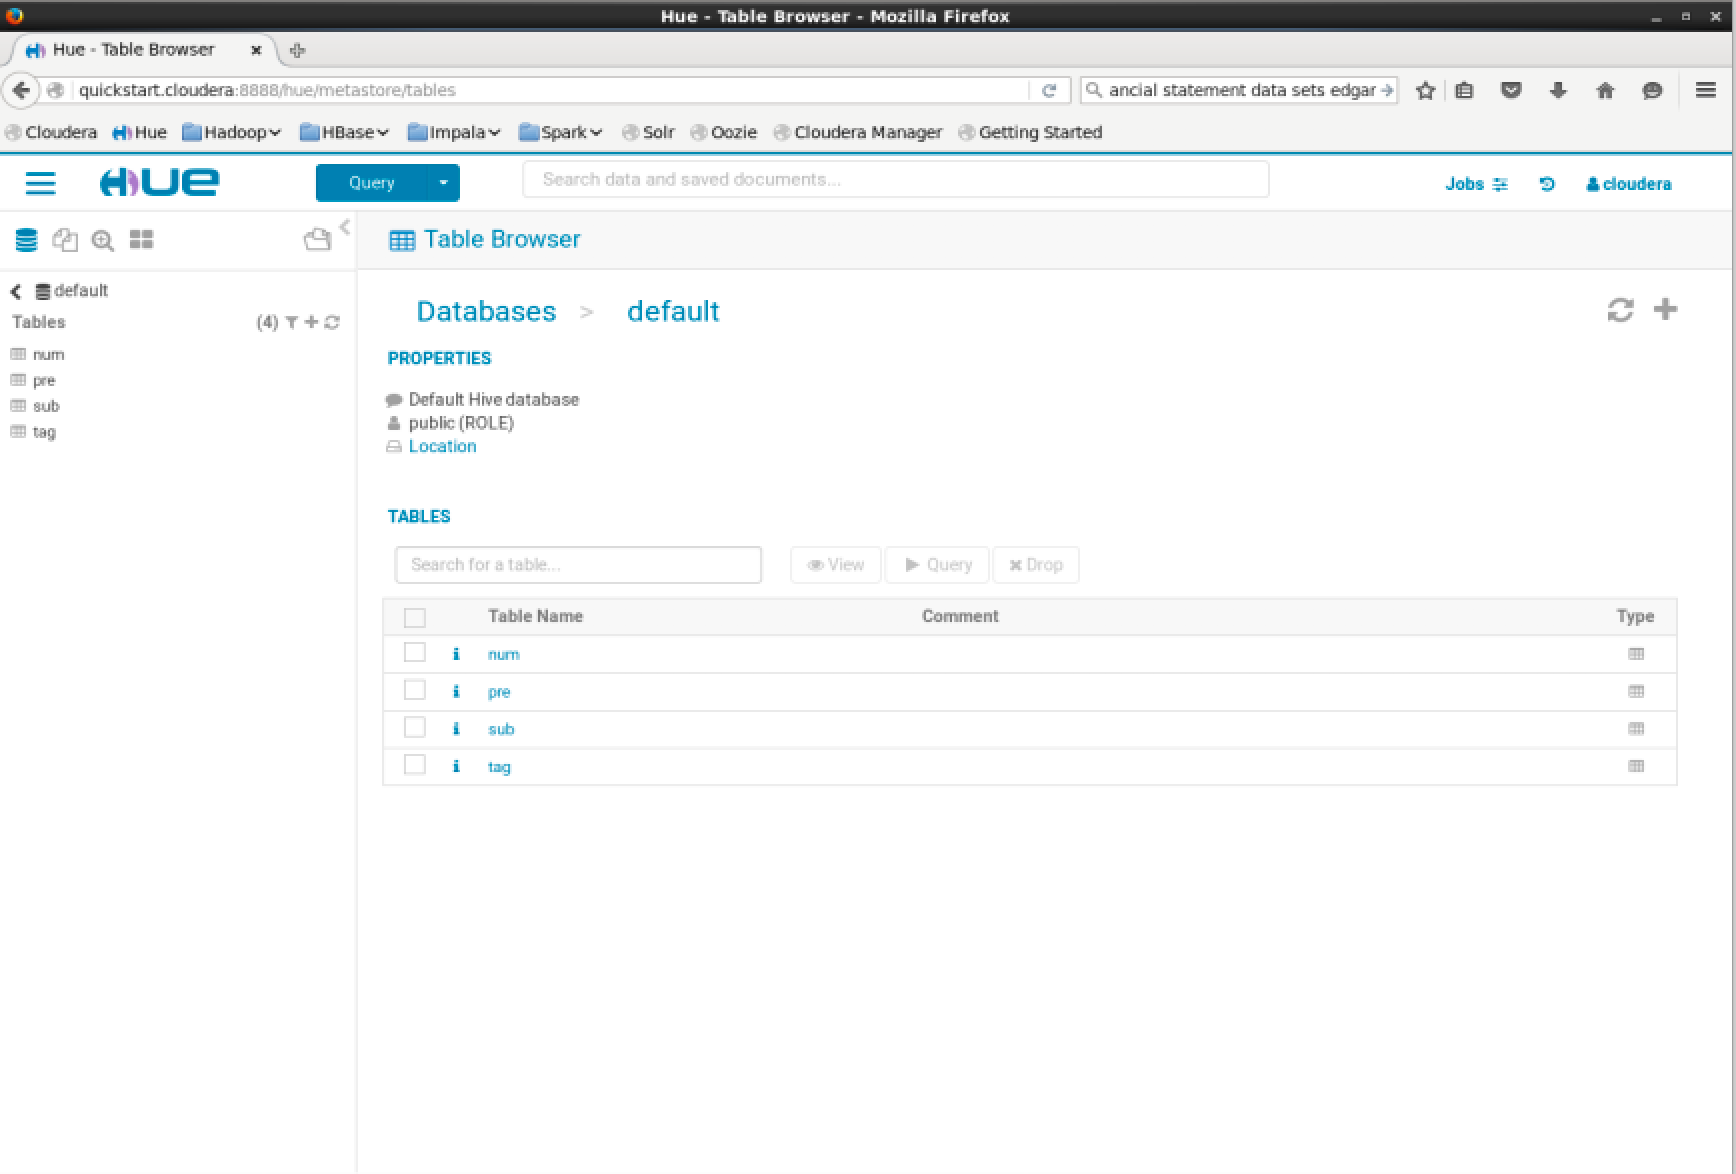
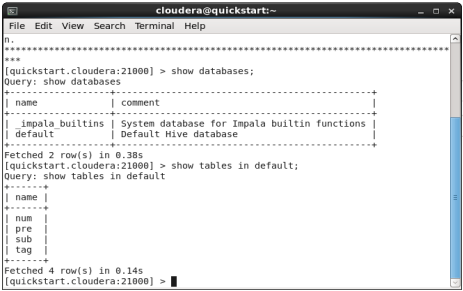
Repeat the steps above for the other files. Once that is completed you should see 4 tables in the default table schema: num, sub, tag and pre.
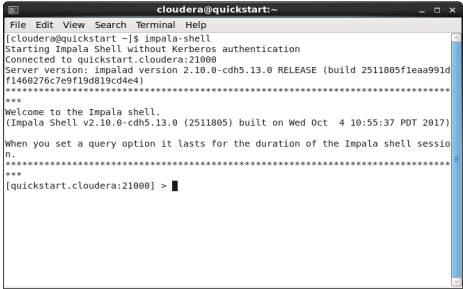
You should now be able to see these tables in the impala shell. Open the terminal and run:1
$ impala-shell
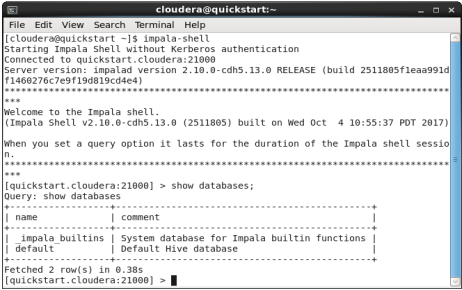
To list the databases in impala run the show databases command:1
> show databases;
To list the tables in the default database run the show tables command:1
> show tables in default;
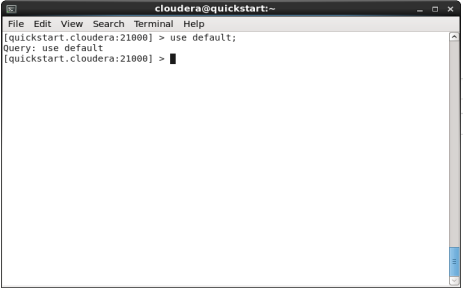
To choose a database as a context for subsequent sql commands, issue the use database command:1
> use default;
Tables are the primary containers for data in Impala. Logically, each table has a structure based on the definition of its columns, partitions, and other properties.
Physically, each table that uses HDFS storage is associated with a directory in HDFS. The table data consists of all the data files underneath that directory:
- Internal tables are managed by Impala, and use directories inside the designated Impala work area.
- External tables use arbitrary HDFS directories, where the data files are typically shared between different Hadoop components.
- Large-scale data is usually handled by partitioned tables, where the data files are divided among different HDFS subdirectories.
To query what type table we have created in impala, run the describe formatted command:1
> describe formatted tag;
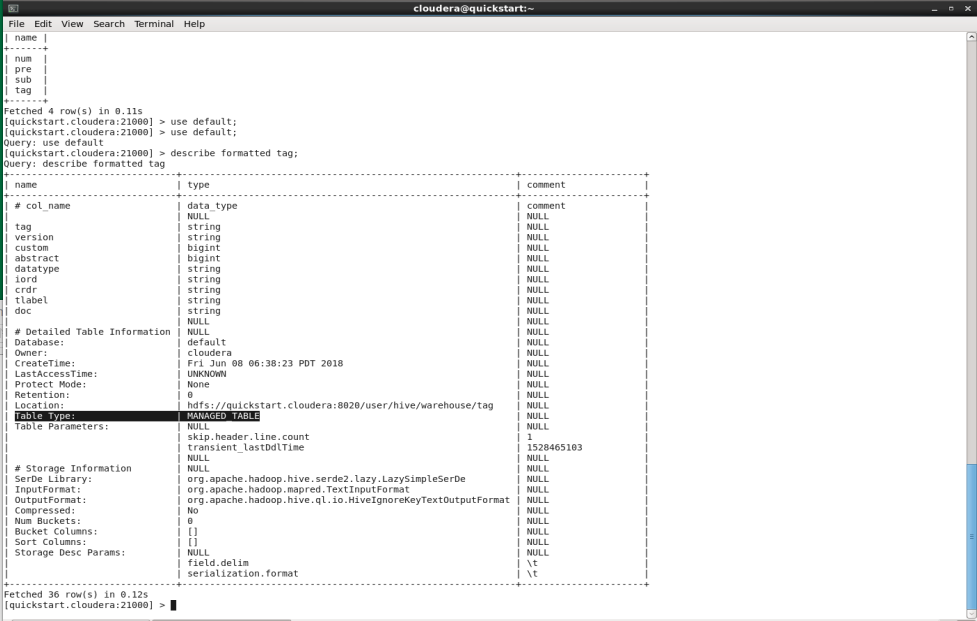
The Table Type field displays MANAGED_TABLE for internal tables and EXTERNAL_TABLE for external tables.
Performing a simple query
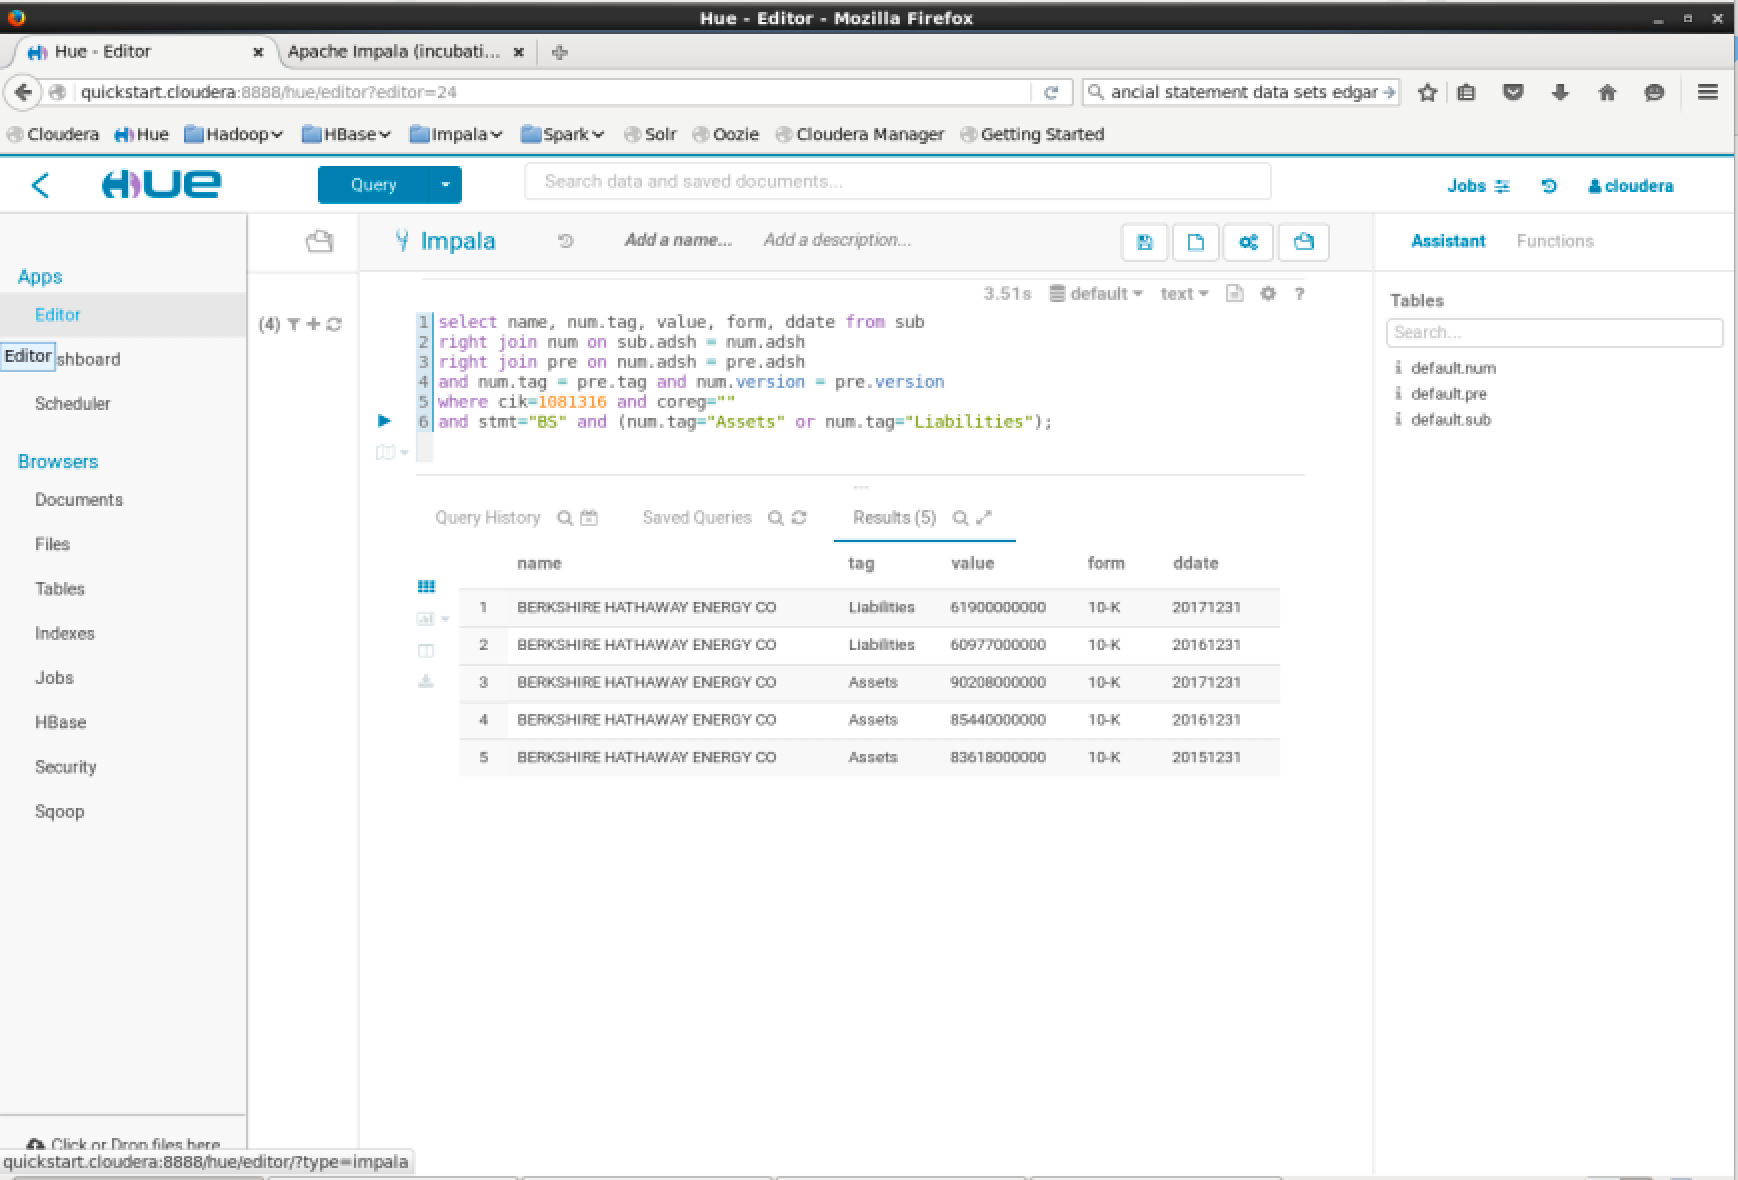
Cloudera provides a SQL based web interface to query the data in Hive using Impala. Hue includes a SQL query interface under Hue -> Hamburger Menu -> Apps -> Editor. In this page you can enter queries to retrieve your data from database tables. A simple query might be: select values from a balance sheet:
1 | select name, num.tag, value, form, ddate from sub right join num on |
Notes:
- CIK# 1081316 refers to Berkshire Hathaway Energy Co
- When we specify a condition: num.tag=”Liabilities”, this refers to the XBRL code to specify the US GAAP entry. This can be found through the SEC website on interactive documents, which will allow you to click on cell values in their accounts to display the relevant GAAP code.
Once your query is ready, to run it press the triangular play button on the left of the textarea.
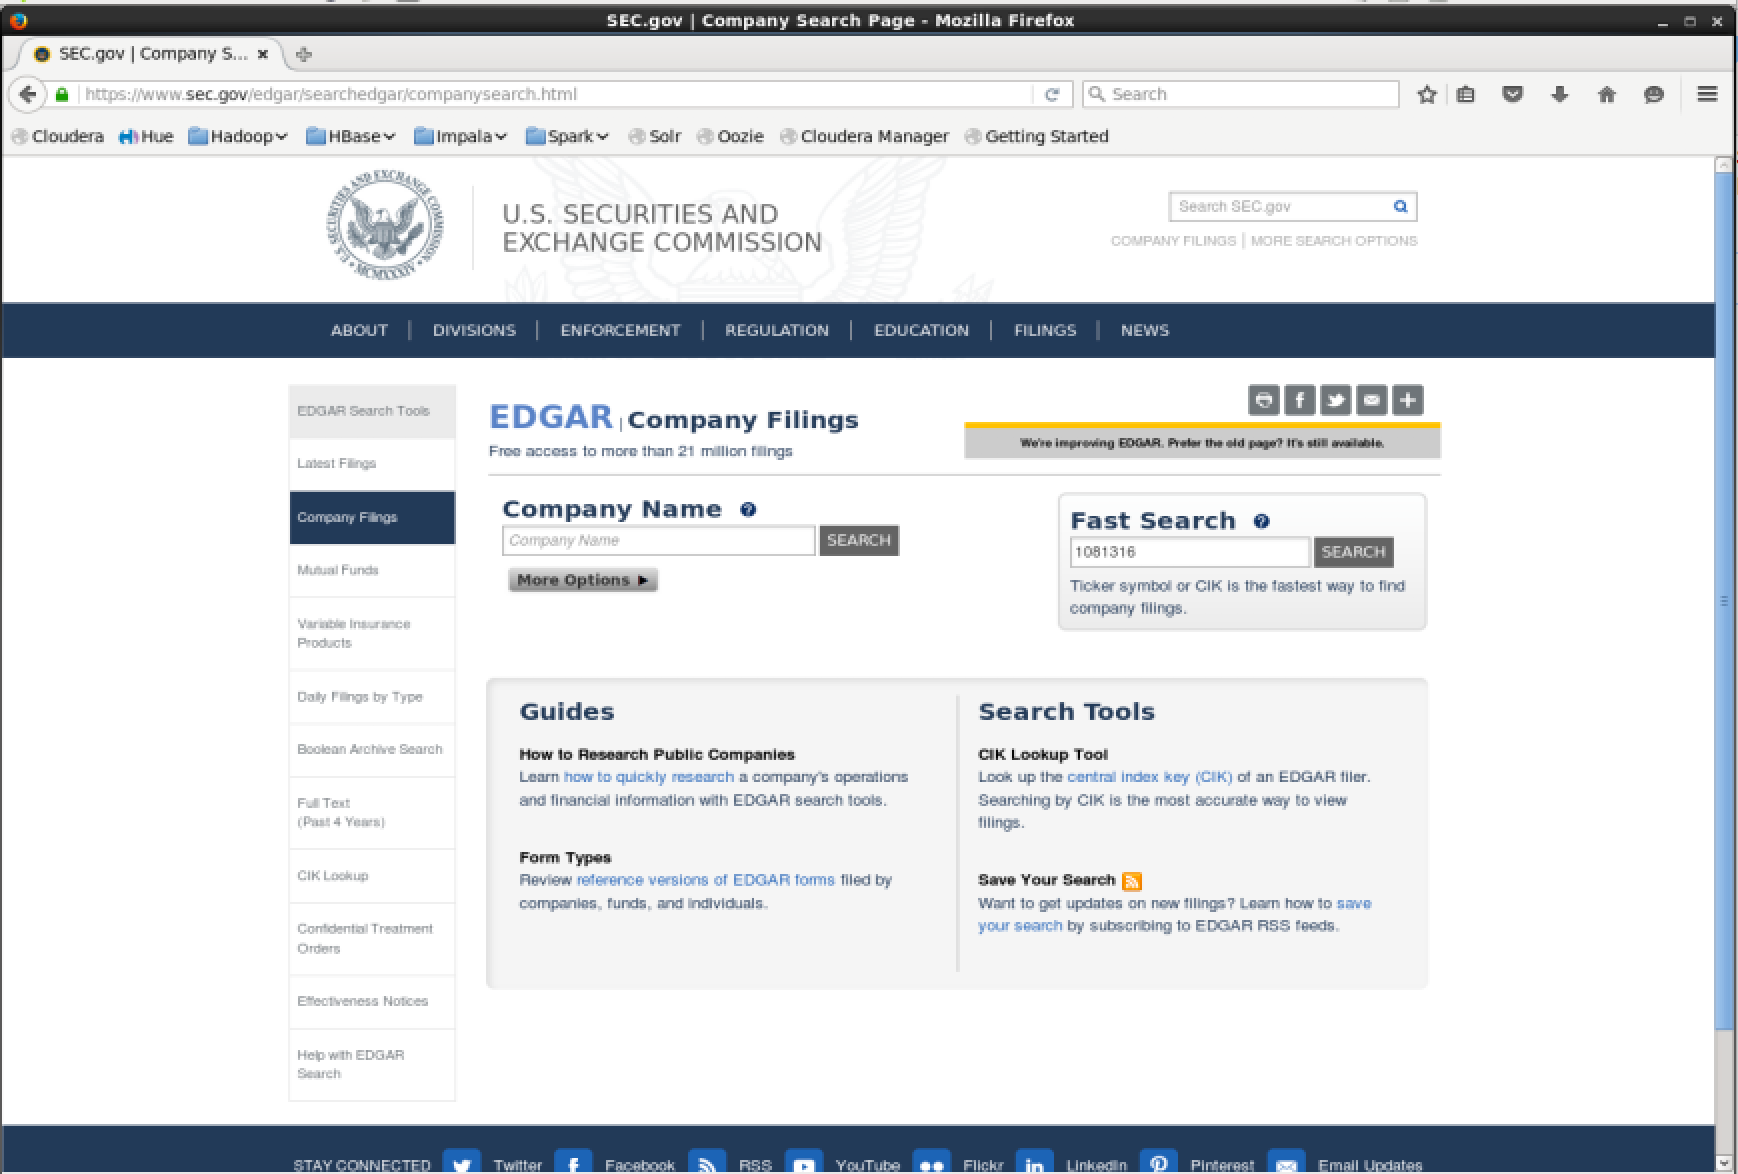
As mentioned previously, the SEC XBRL data can be queried using widely agreed upon reference codes. Finding these is straightforward. Navigate to the EDGAR website. In the “Company Name” search input a value, or alternatively in the fast search input a CIK# and press “Search”. This will display the forms a company has submitted to EDGAR.
Some documents are available in “Interactive Mode” and are signified by a blue button.
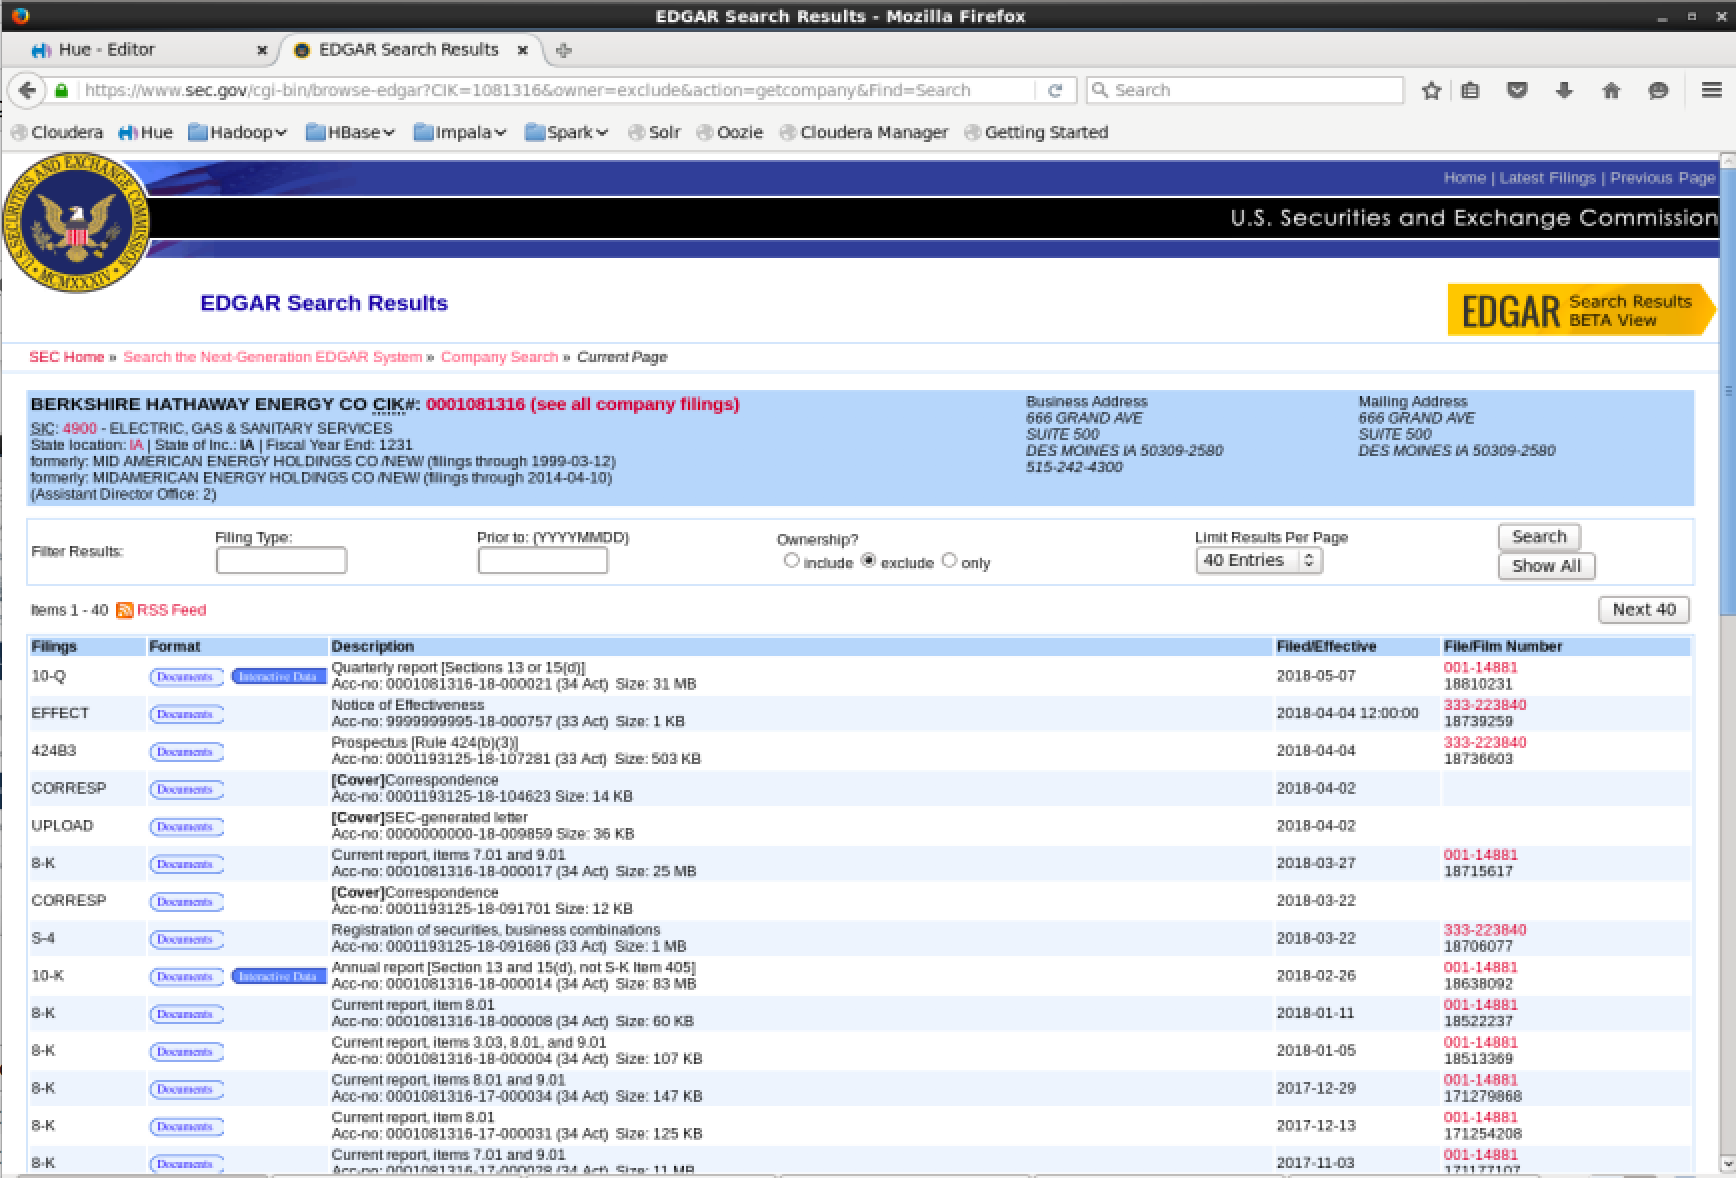
Opening a 10-K form in interactive mode allows you to go through the submission including documents such as Income Statement, Cash Flow Statement and Balance Sheet.
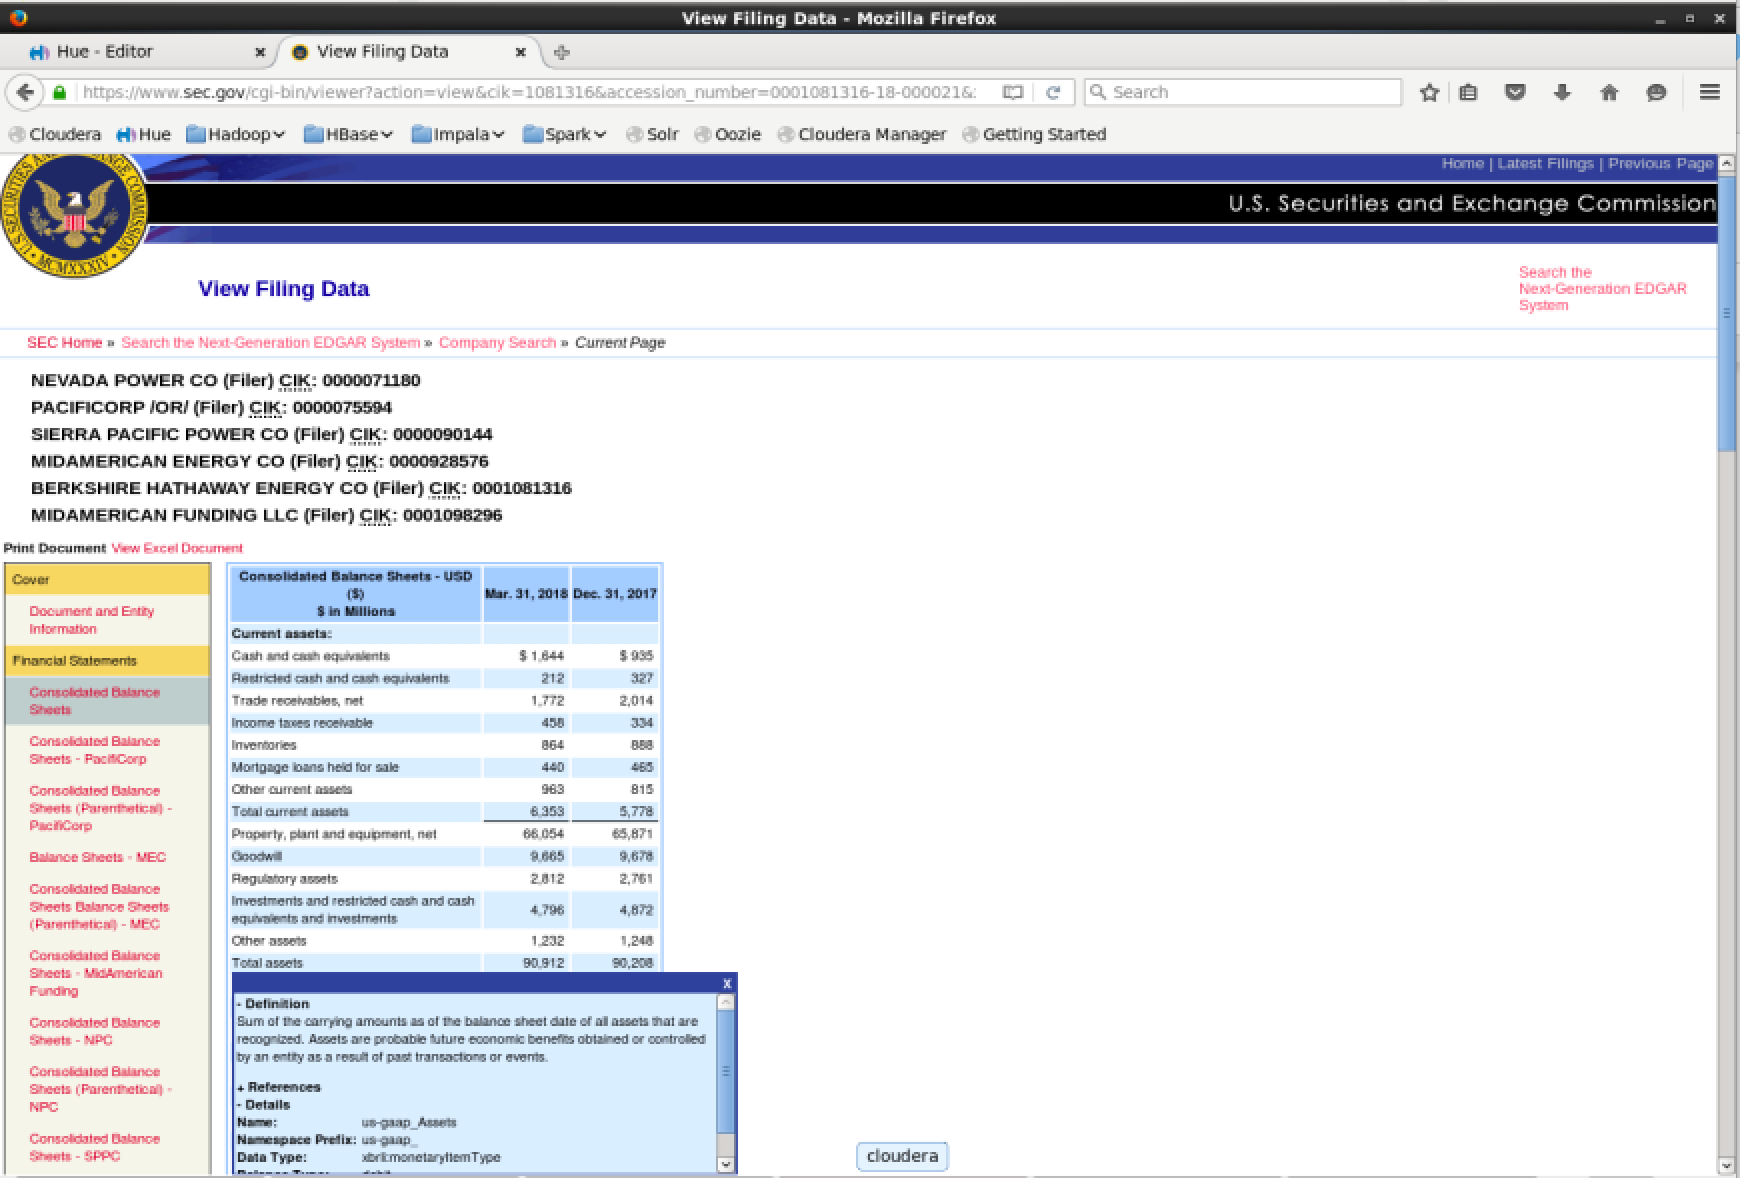
Open a balance sheet and click on one of the fields. If the document is open in interactive mode it will display a popup. Drill down into the “Details” submenu of the popup and you can see fields such as “Name”, “Namespace Prefix” and “Data Type”.
- Name: us-gaap_Assets
- Namespace Prefix: us-gaap_
- Data Type: xbrli:monetaryItemType
- Balance Type: debit
- Period Type: instant
By subtracting the Namespace Prefix from the Name field, we are left with the value “Assets”. This is the Name suffix, which corresponds to the table column num.tag.
Extracting Ticker Symbols
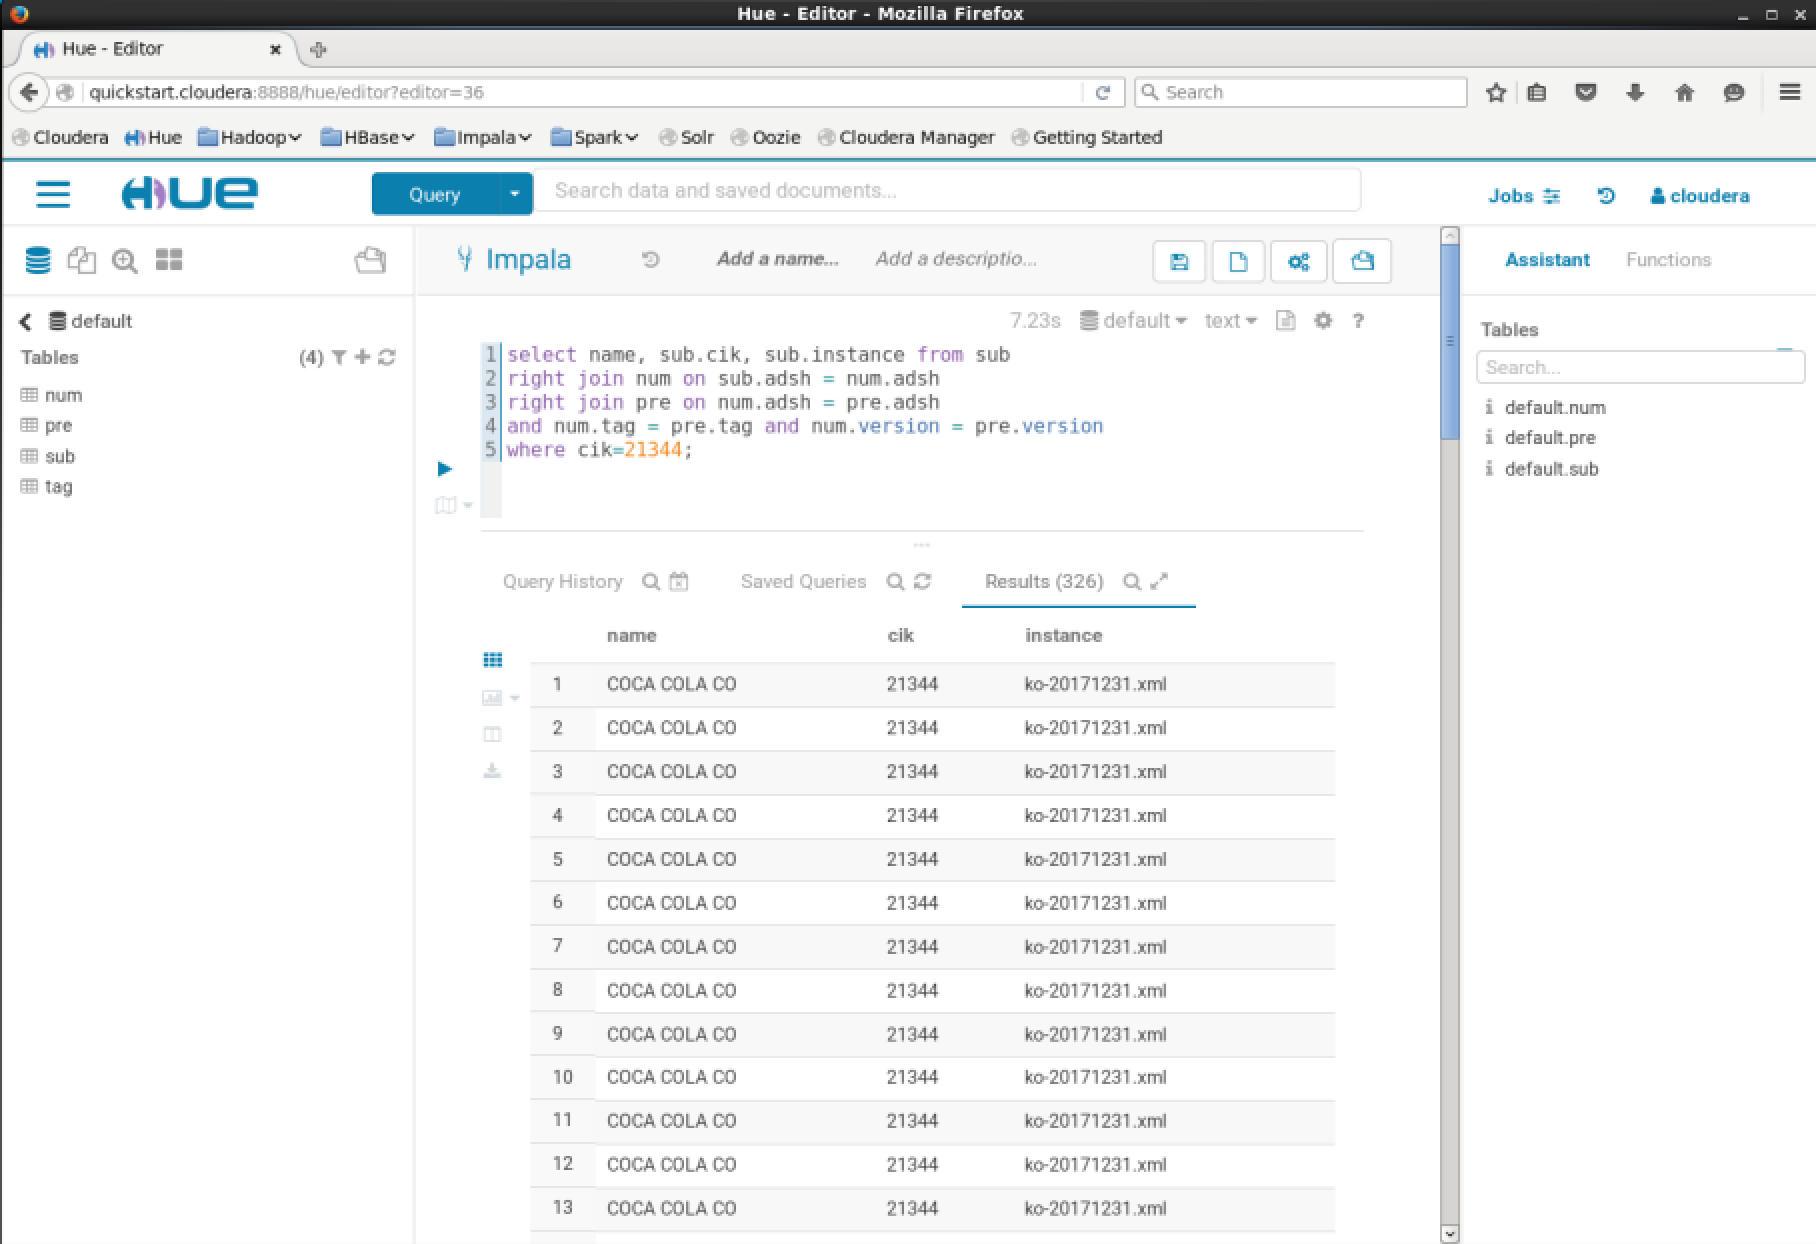
In the EDGAR dataset there are 2 columns of interest: sub.cik and sub.instance. The sub.instance column contains the filename submitted to the SEC which has a prefix of the ticker symbol. This data can be queried with SQL.
1 | select name, sub.cik, sub.instance from sub |
The suffix can easily be removed to extract the ticker symbol. This can be done easily in SQL.
1 | select name, sub.cik, split_part(sub.instance, "-", 1) as Ticker |
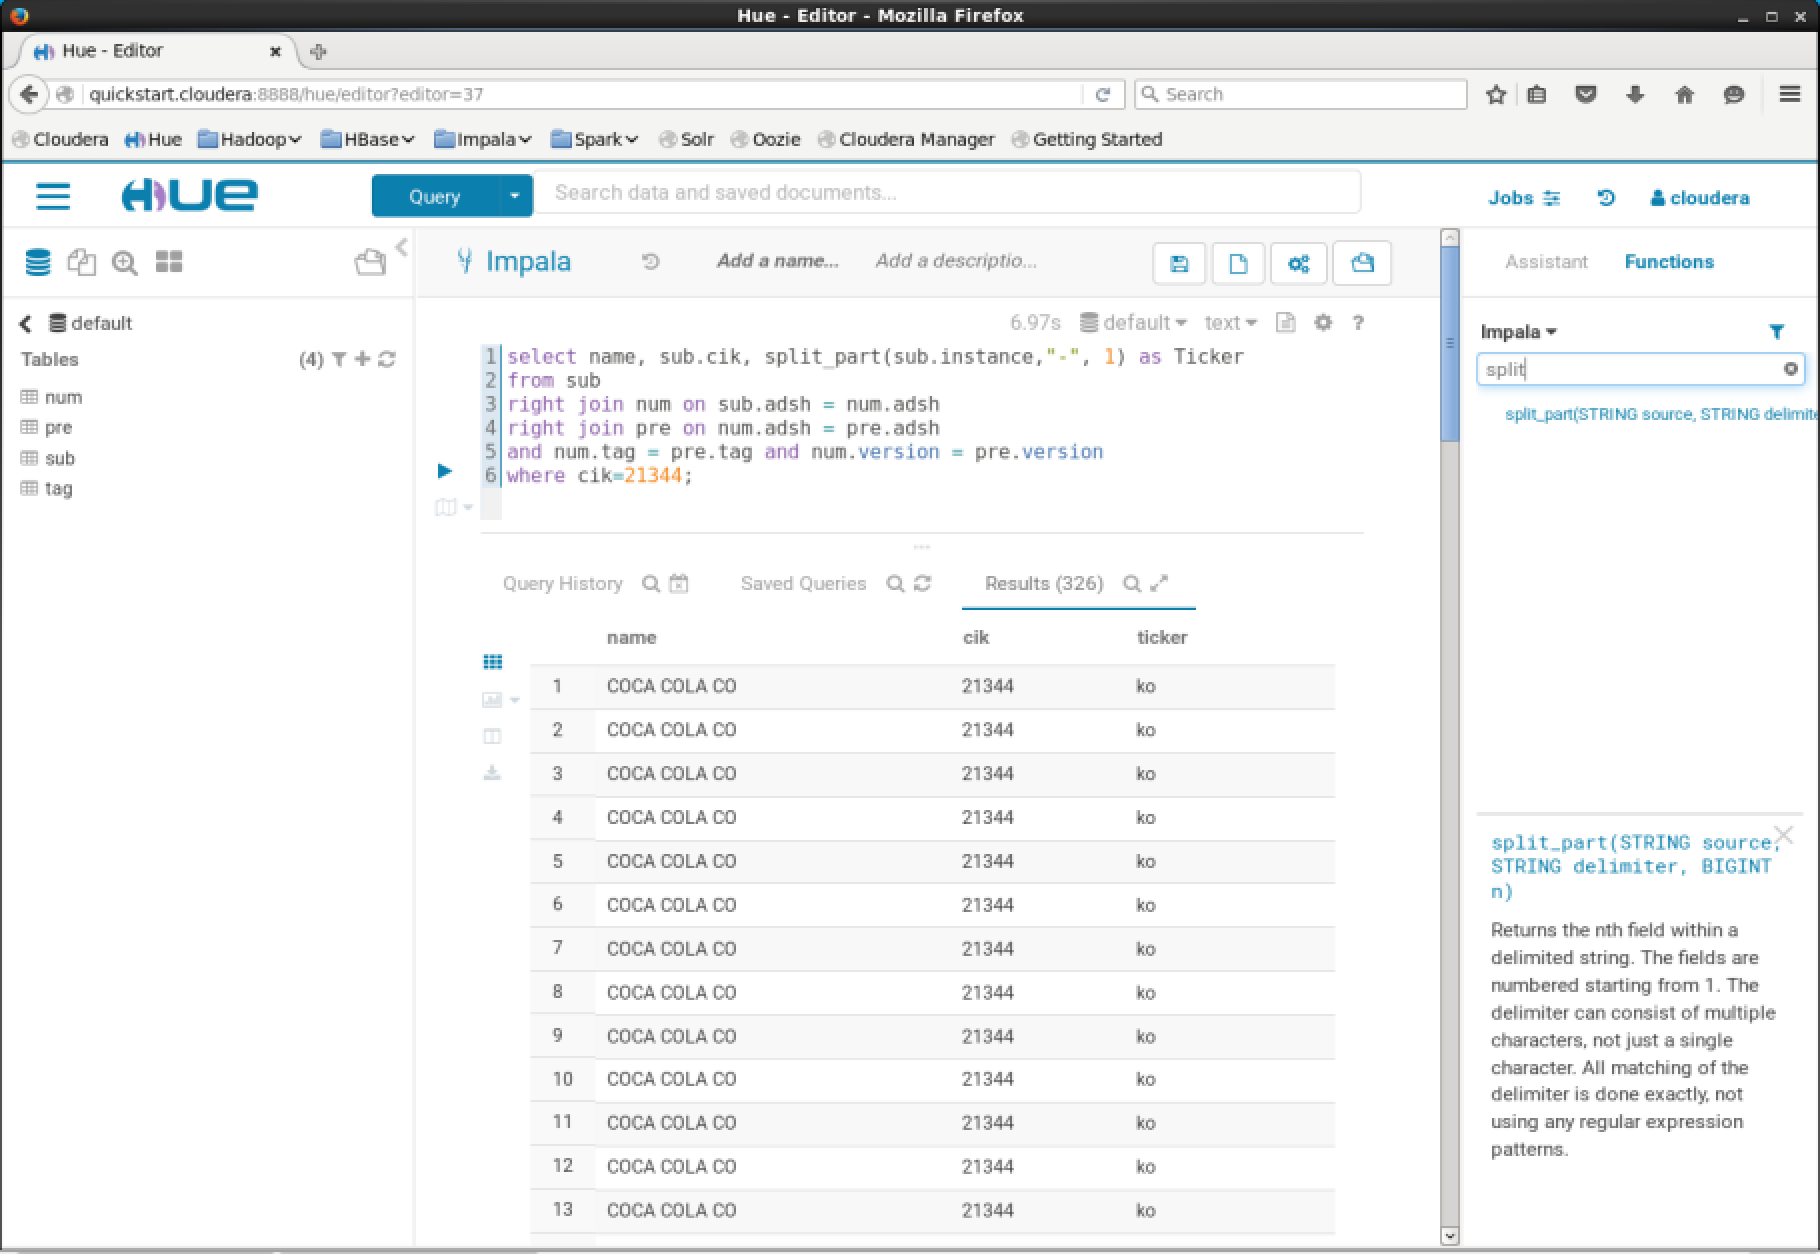
You can then use this to download the appropriate historical price data from Yahoo or another third party service. There are however some issues with this. This may cause issues if a company has changed it’s ticker symbol during it’s time as a publicly traded company.
Yahoo Price Data
Yahoo have made their price data freely available to download in CSV format. To map this to the EDGAR data, the least granular time period can be used (monthly), and the time scale can be from 2009-present, as the EDGAR data only goes back as far as 2009. Perform a simple search for Coca Cola.
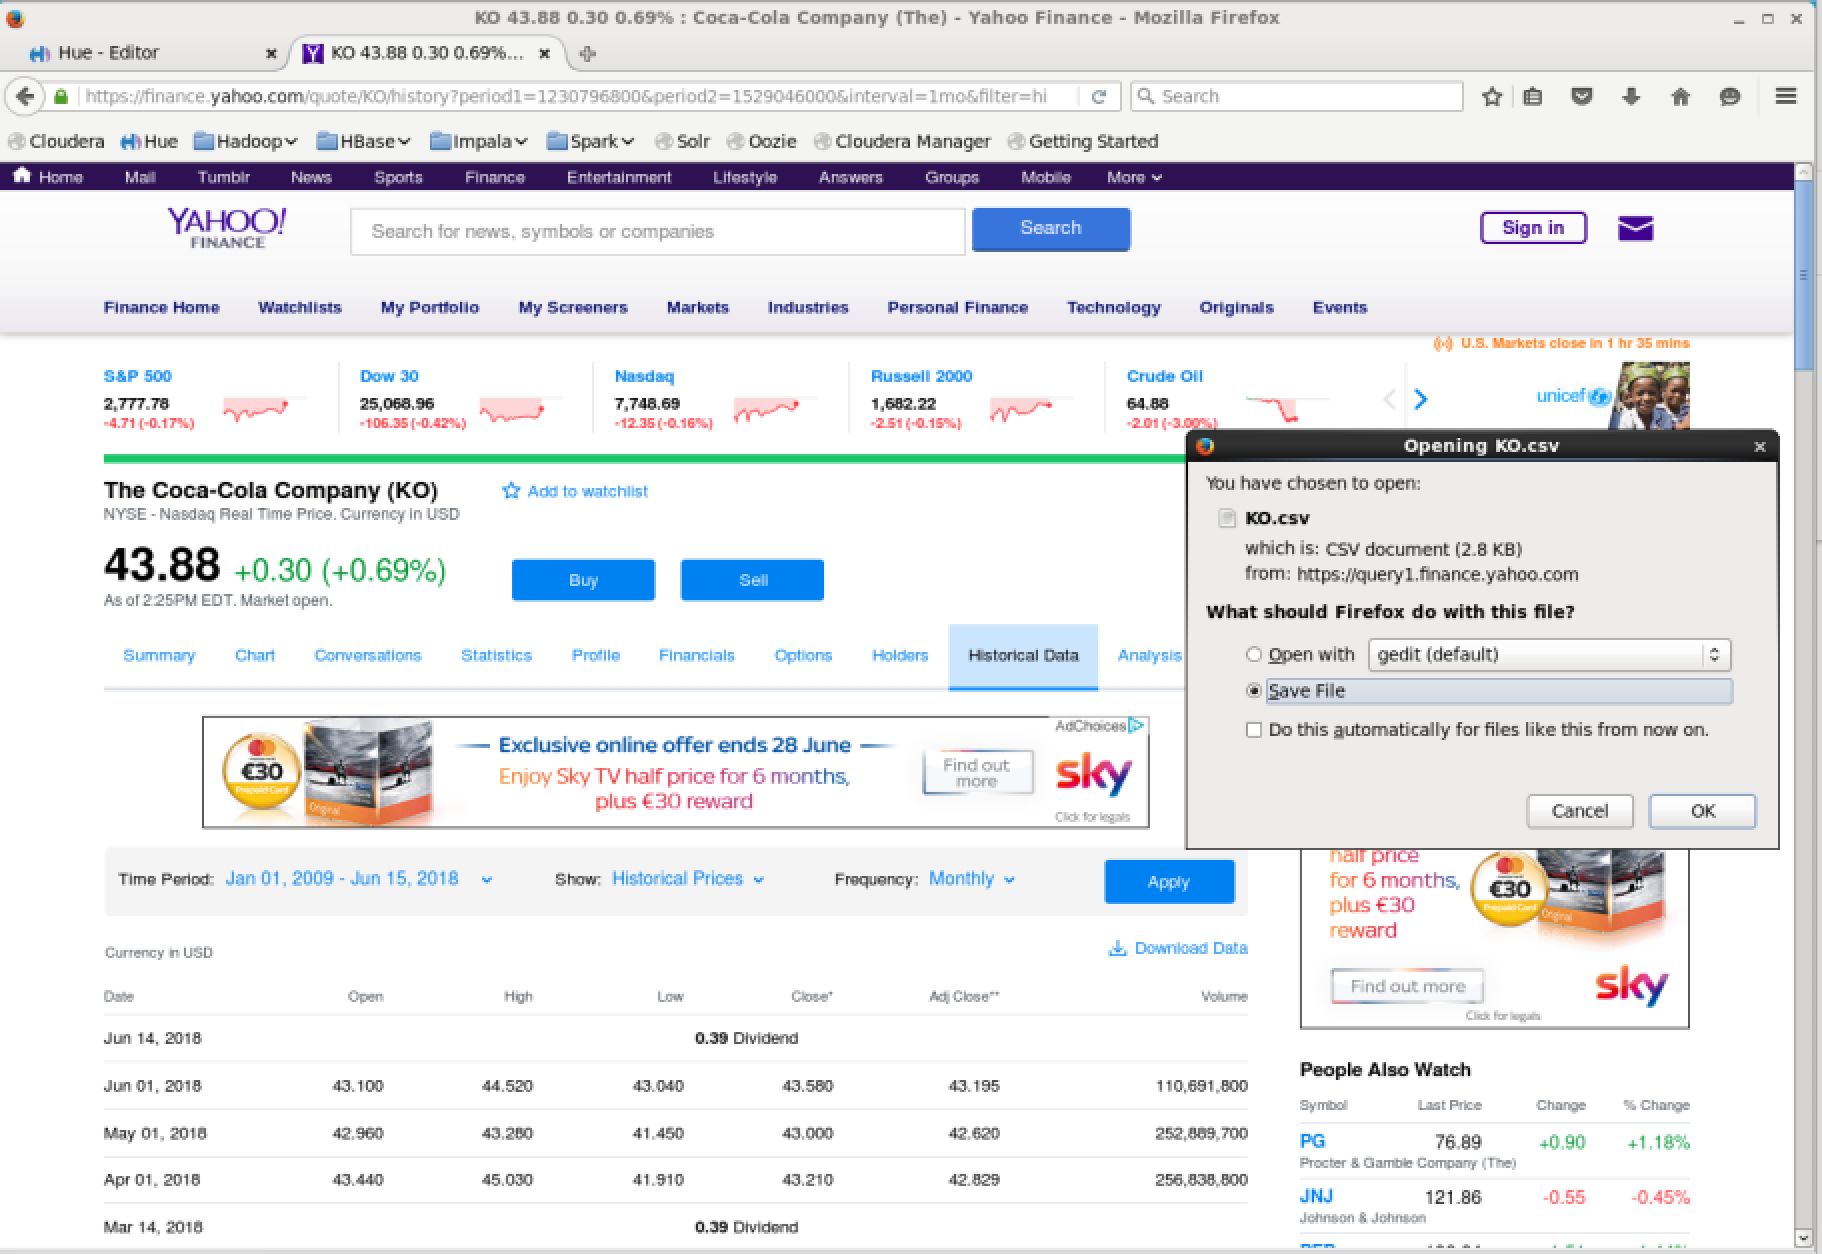
Once this is downloaded it will be in CSV format, this can be imported to a KO table and the rows can be joined using their date columns.
Summary
It is possible to perform detailed research of historical company performance on a large scale, and also include the price information. This can all be done at home for free with out the need for any special resources that are not already available for free on the internet. The process of downloading the price data for all ticker symbols can probably be automated using a bash script, but that will not be covered here.